Heavy Wet Snowstorm of
October 4, 1987
submit storm photos and storm reports ------> hugehail@yahoo.com
***Please note that this site is in its infancy and mispellings/grammatical erroes may exist***
Introduction
On
October 4, 1987, an unusual early-fall snowstorm affected eastern New
York, western Massachusetts, western Connecticut and Vermont.
For areas east of the Hudson River in Renssalaer and northern Columbia
counties, the heaviest snow occurred between
09 and 17 UTC (5am to 1 pm EDT). Snowfall rates of
3"/hr were common in the areas of heaviest snow. The heavy snow began a
little earlier further south. The first batch of heavy snow
occurred between 22 UTC 3rd (6 pm) and 10 UTC 4th (3am) over the
Catskill Mountains where
up to 21" of snow was reported. Another area extended from northeastern
Westchester
county, NY northward into Renssalaer county NY and then
north-northeastward into southwestern Vermont. Even locations near the
Hudson River at lower elevations received heavy snow. In fact, 10" of
snow fell at 300 ft. elevation about 1 mile east of the Hudson River in
Troy. Adjacent areas of
western Connecticut and western Massachusetts also received very heavy
snow. This is the earliest documented major snowstorm to affect
eastern New York in recorded history. The event was particularly
devastating since trees at lower elevations (below 2000 ft) were fully
leaved. Snow collected on the leaves and the resultant weight brought
down many limbs and caused several hundred thousand residents to lose
power for up to a week or more. Heavy rain preceded the snow, with some
locations receiving 1 to 1.5". Despite the warm ground temperatures and
soaked ground, the snow still accumulated rapidly. The often repeated
myth that snow cannot accumulate with warm ground temperatures is
clearly refuted in this case. In other words, if the snowfall is heavy
enough, it will accumulate!
Snow Documentation
After stumbling onto this event during my
research of the October 9, 1979 heavy wet snowstorm, I decided that
proper documentation needed to be done while the event is still in
the memory of area residents. In addition to storm
documentation by the National Weather Service and snowfall data from the eastern New York Weather
Observing Network (graphical form), strategic phone calls were made to the affected area including town historians, local fire
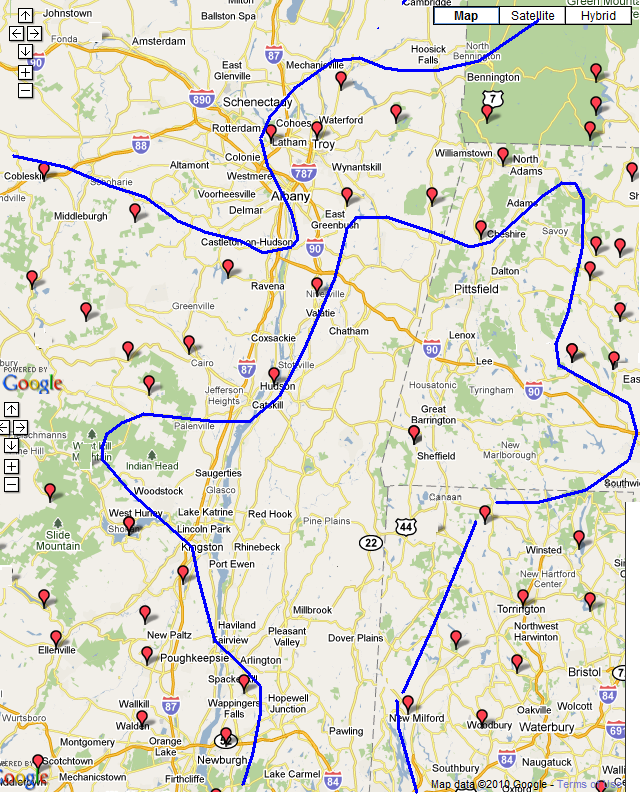
departments, libraries and even local residents. Although the final
product is not complete, this has already resulted in a more
refined snowfall map
for the storm. This is currently in the form of amounts plotted
in google maps. Keep in mind that most of these values were
maximum snow depth measurements and not snowfall. A
large map of snowfall totals with states and counties will
also be developed in the near future. Unfortunately, there was a large
area in eastern NY, western CT and western MA with very few NWS coop
stations that measured snowfall. In fact, there were no coop
stations from extreme southeast Dutchess county to Valatie in northwest
Columbia county (62 mile stretch). In fact there were no coop stations
that reported snowfall across a large part of eastern New York, western
Massachussetts and western Connecticut. In addition, snowfall amounts
were
underestimated at several of the coop sites including Valatie since
some of the obervers did not check the snow depth very often.
A smoothed version of the snowfall map can be found here.
Prior Meteorological Research
A
nice research paper was published in Monthly Weather
Review in 1991 by Lance Bosart and Frederick Sanders (Bosart and Sanders 1991). LaPenta (1988) also provided
some insight into this rare storm.
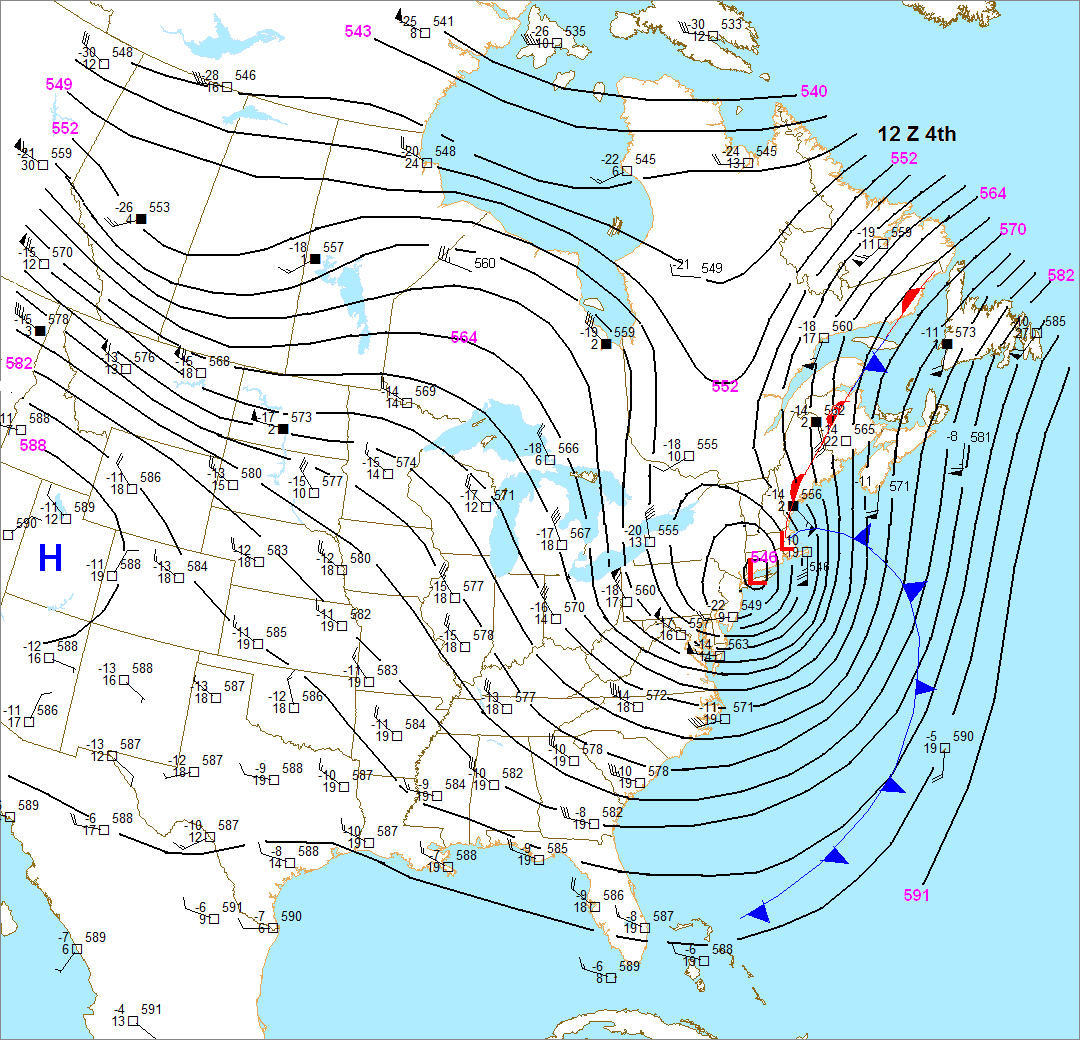
Meteorological Setting
A
strong shortwave trough
progressed southeastward from central Canada into the Great Lakes and
Midwest by October 2. This allowed low level cold air from northern
Canada to spill into the Great Lakes region. The 500mb trough became
neutrally tilted by 12 UTC
October 3 over the Middle Atlantic region. The system underwent strong
baroclinic development between 00 UTC 4th and 18 UTC 4th and lifted
north-northeastward in negative tilt fashion. Strong surface cyclogenesis
occurred, with the central pressure of the surface low dropping from
1008 to 990mb. By 13 UTC October 4th the surface cyclone began the occlusion process.
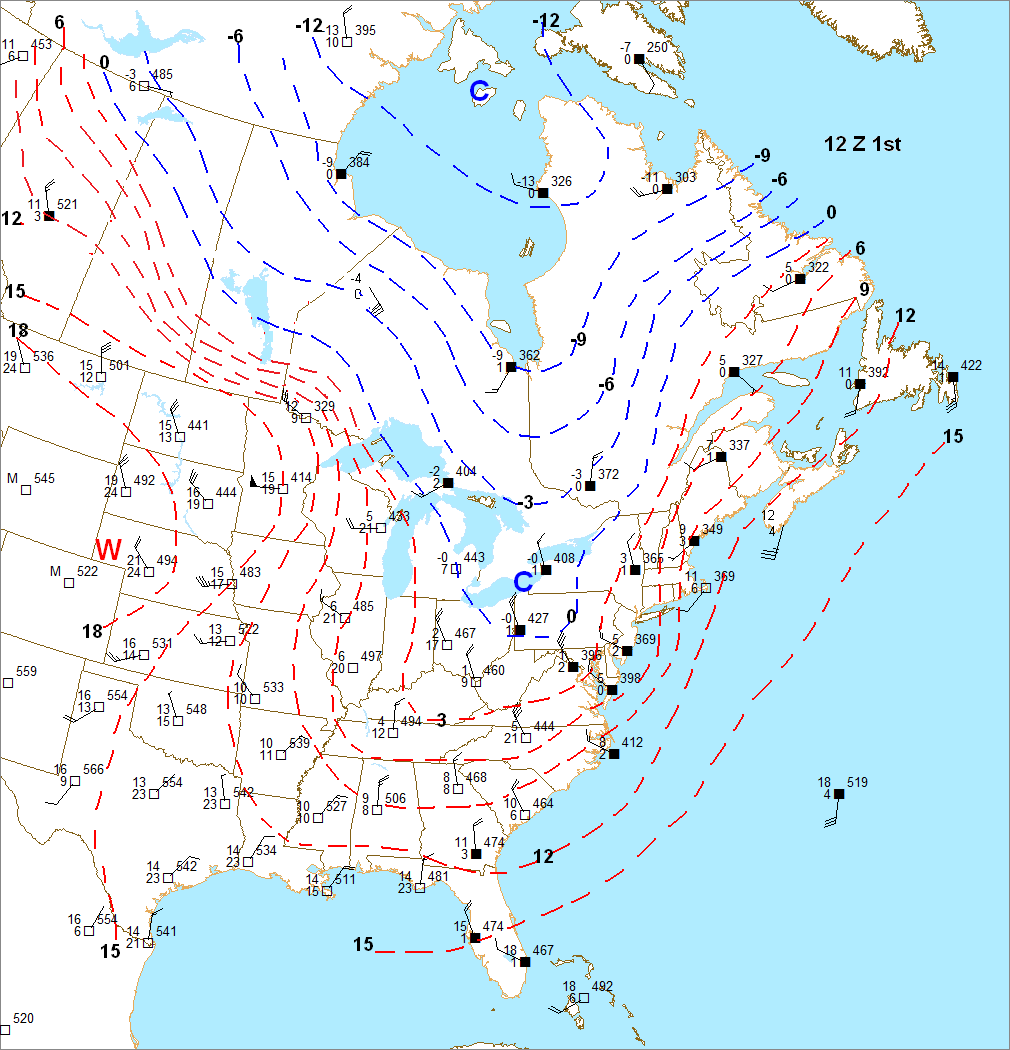
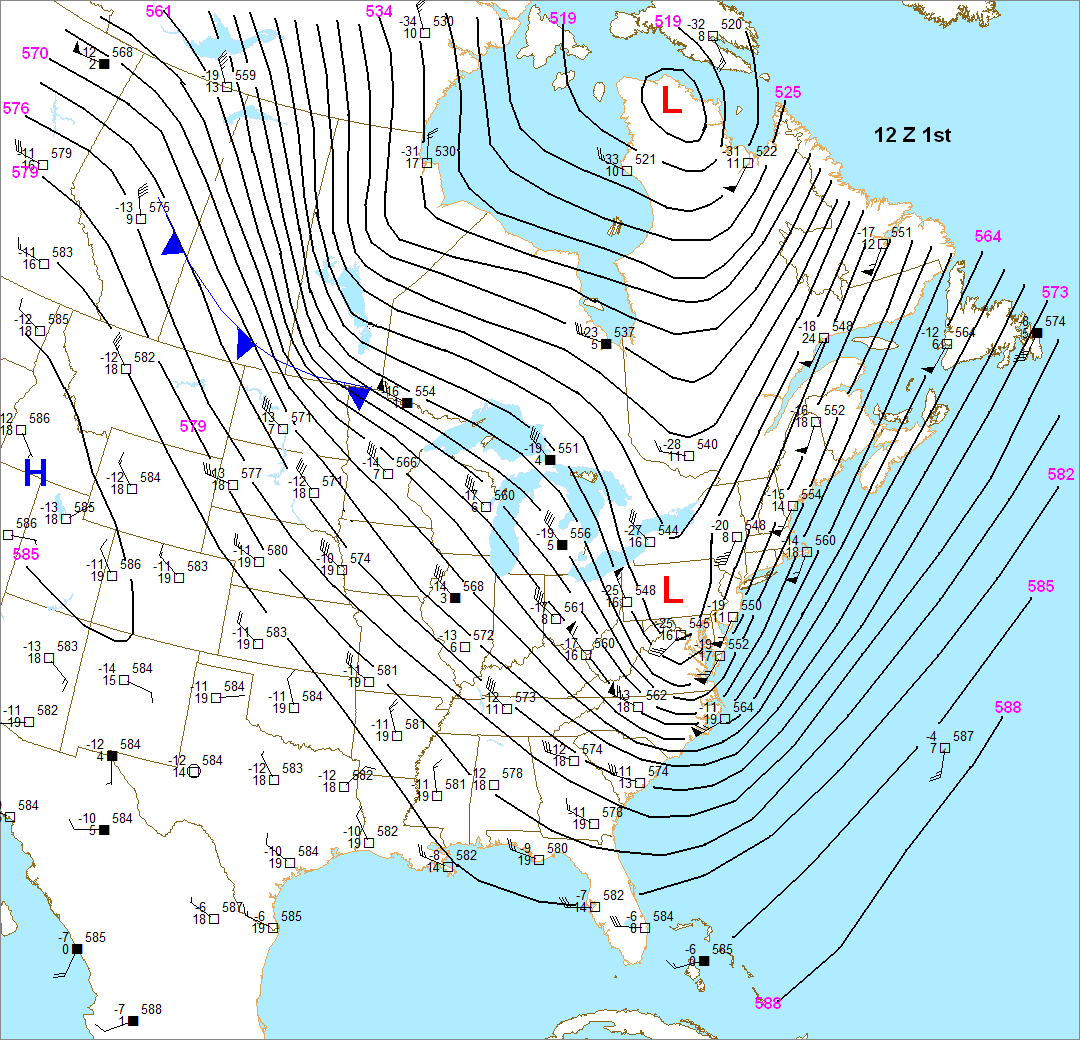
The low level cold air originated over Hudsons's Bay and
adjacent central and northern Canada on October 1. This 850mb chart
from 12 UTC 1st
shows 0C and colder isotherms in blue and +3C and
warmer isotherms in red. At this time, there was a large pocket of cold
air with
temperatures below -10C over the central and Northern part of Hudson's
Bay. The 850mb baroclinic zone associated with this cold airmass was
situated over southern Canada and was starting to charge south with the
passage of a strong shortwave trough dropping south-southeasward from
Canada. The 500mb
chart with 850mb cold front overlayed shows that the 850mb front was
situated immediately ahead of the upper trough. This chart was analyzed
to the best of my ability given the paucity of upper air data. A key
upper air site at The Pas, Manitoba did not report at 12
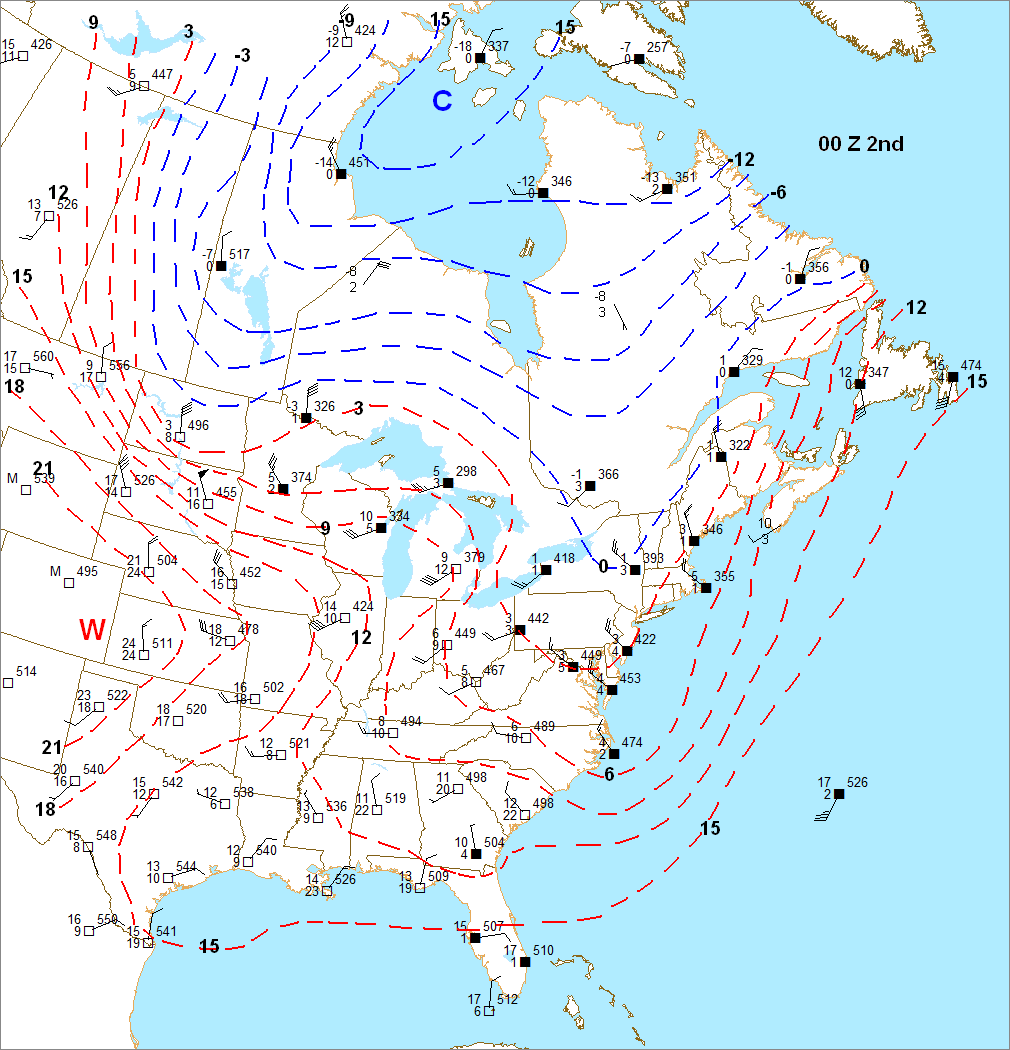
UTC. By 00 UTC 2nd, the southern edge of this
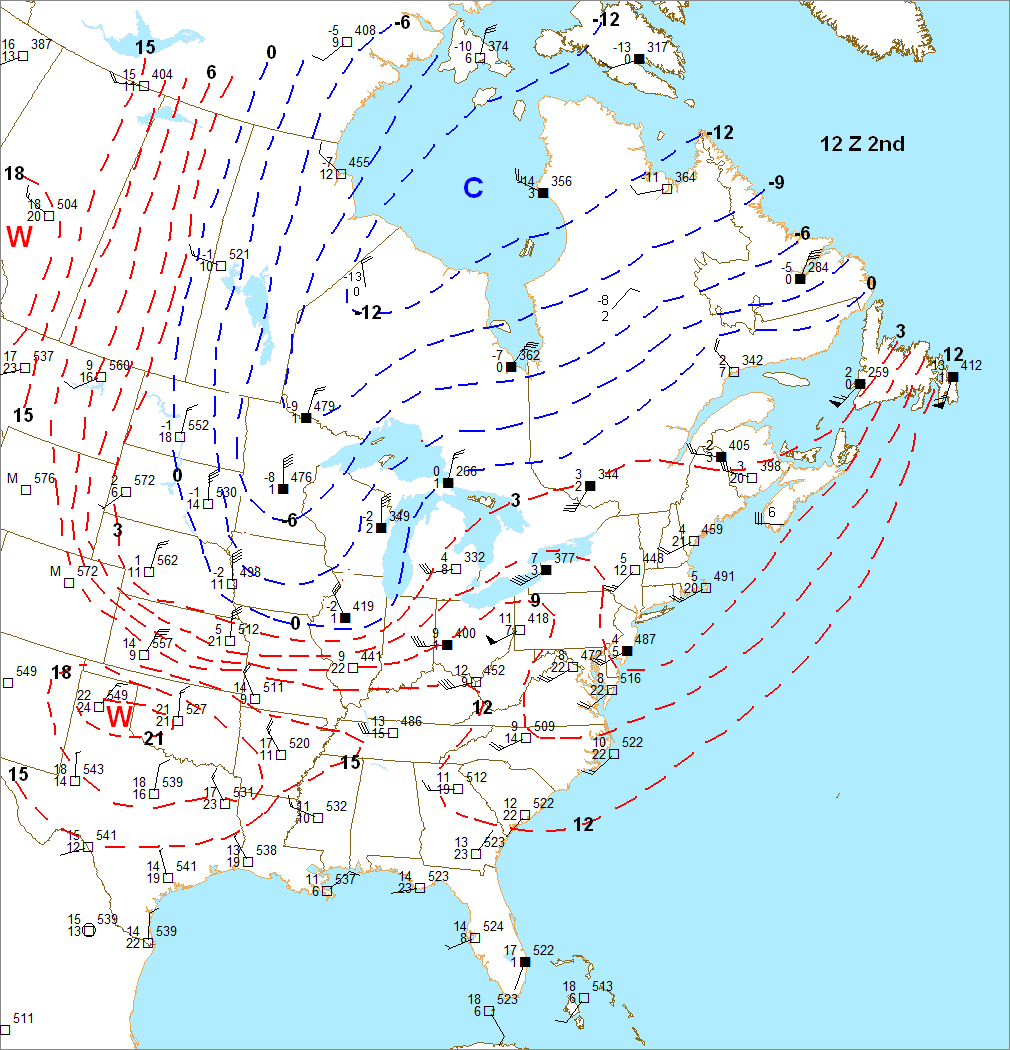
cold airmass was charging south into the northern Plains. The 850mb cold front was still just ahead of the intense shortwave trough. By 12
UTC2nd, the cold front stretched from Joplin to Evansville to Cleveland and was still located just out in front of the deep upper trough.
By 00 UTC 3rd,
the front was moving through western PA and eastern TN and was
still out ahead of the strong shortwave trough. The upper trough and
front had slowed considerably by this time By 12 UTC 3rd the front stretched from Atlanta to Greensboro to east of
Washington, DC to west of Albany, NY and into Quebec and was still located just ahead of the upper trough. By 00 UTC
4th the front had slowed dramatically in the northeast but was still
charging eastward off the eastern seaboard. The front stretched from
east of Hatteras to New England. A wave was forming off the NJ coast by
00 UTC 4th.
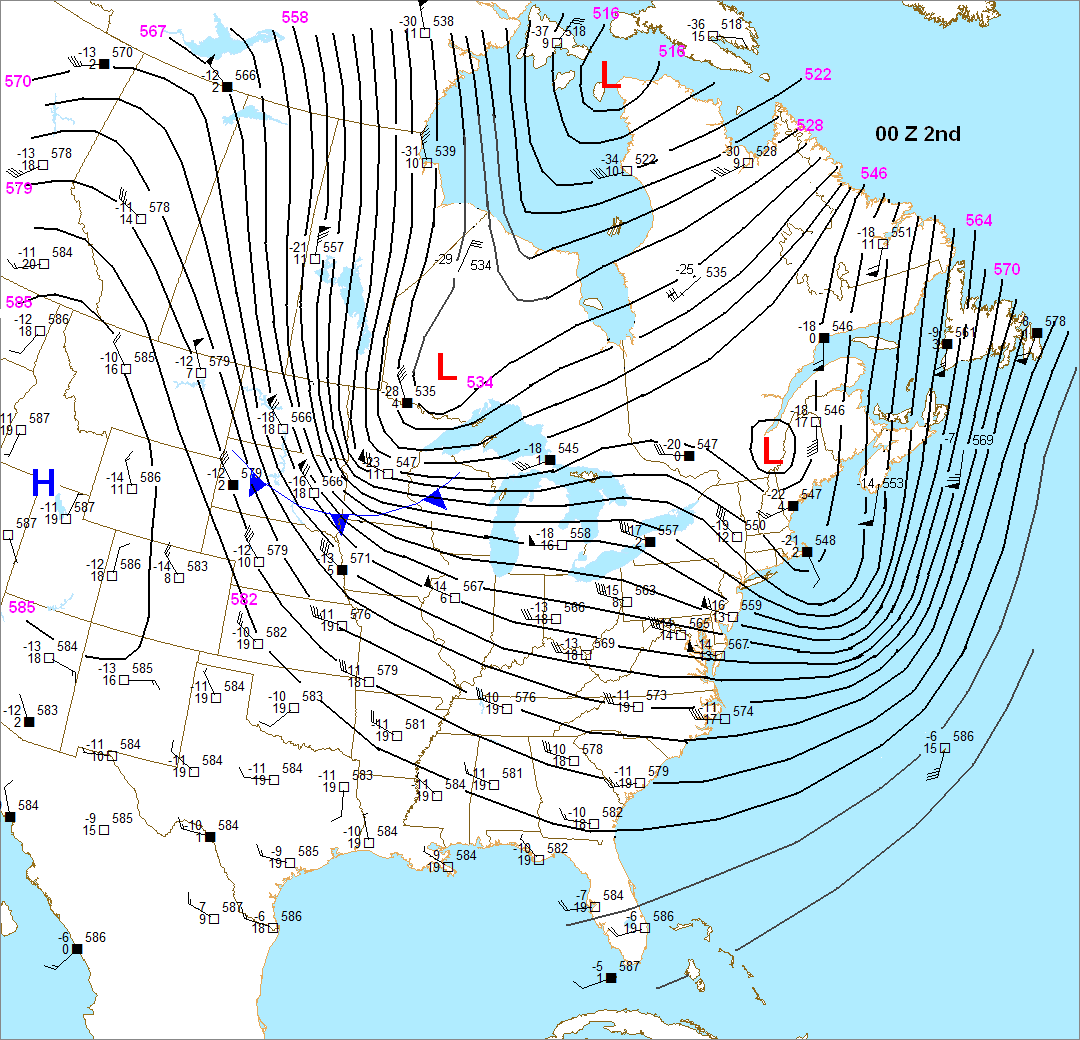
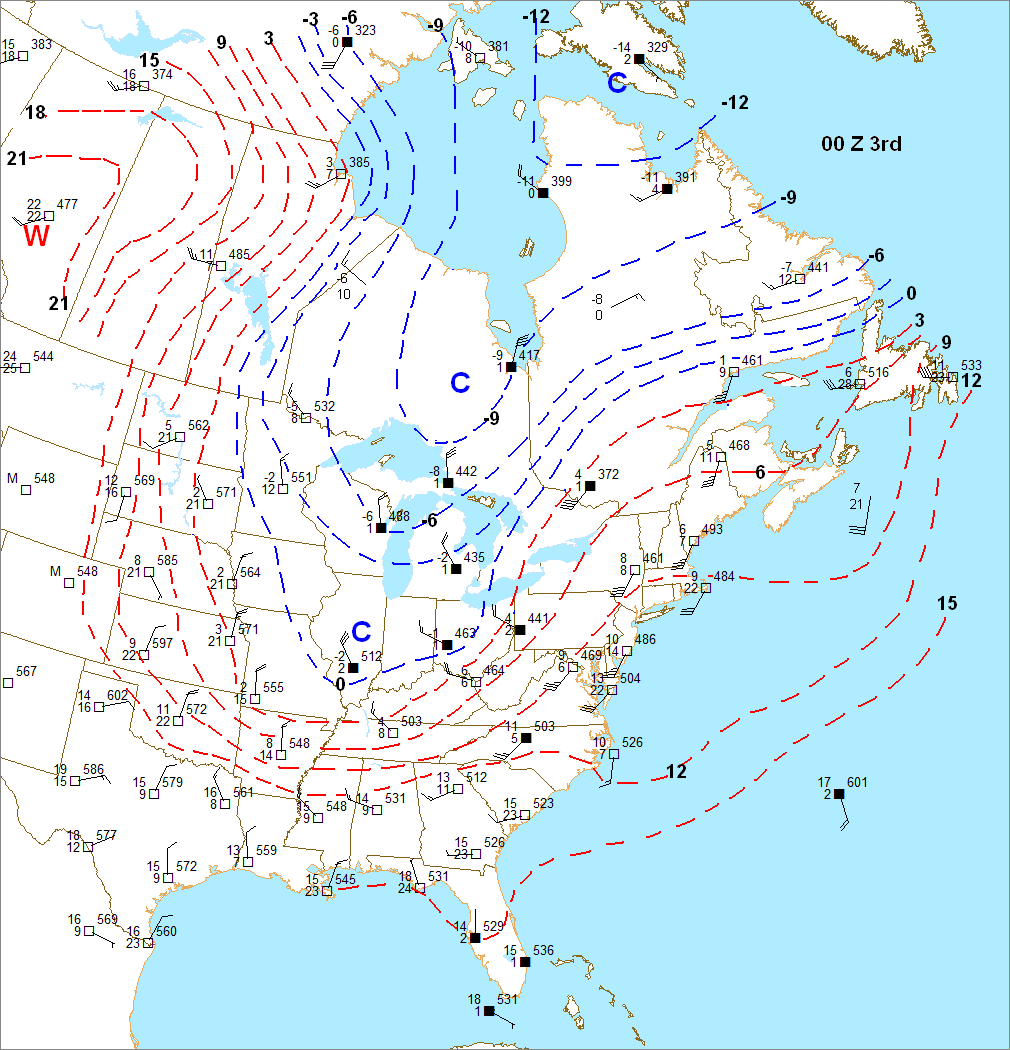
The 500mb chart with the 850mb low and front overlayed shows that the
upper low was still well removed from the low level circulation.
However, by this time the upper trough was neutrally tilted as it
approached the Atlantic seaboard, with strong vorticity advection
undoubtedly becoming situated over the low level circulation, leading
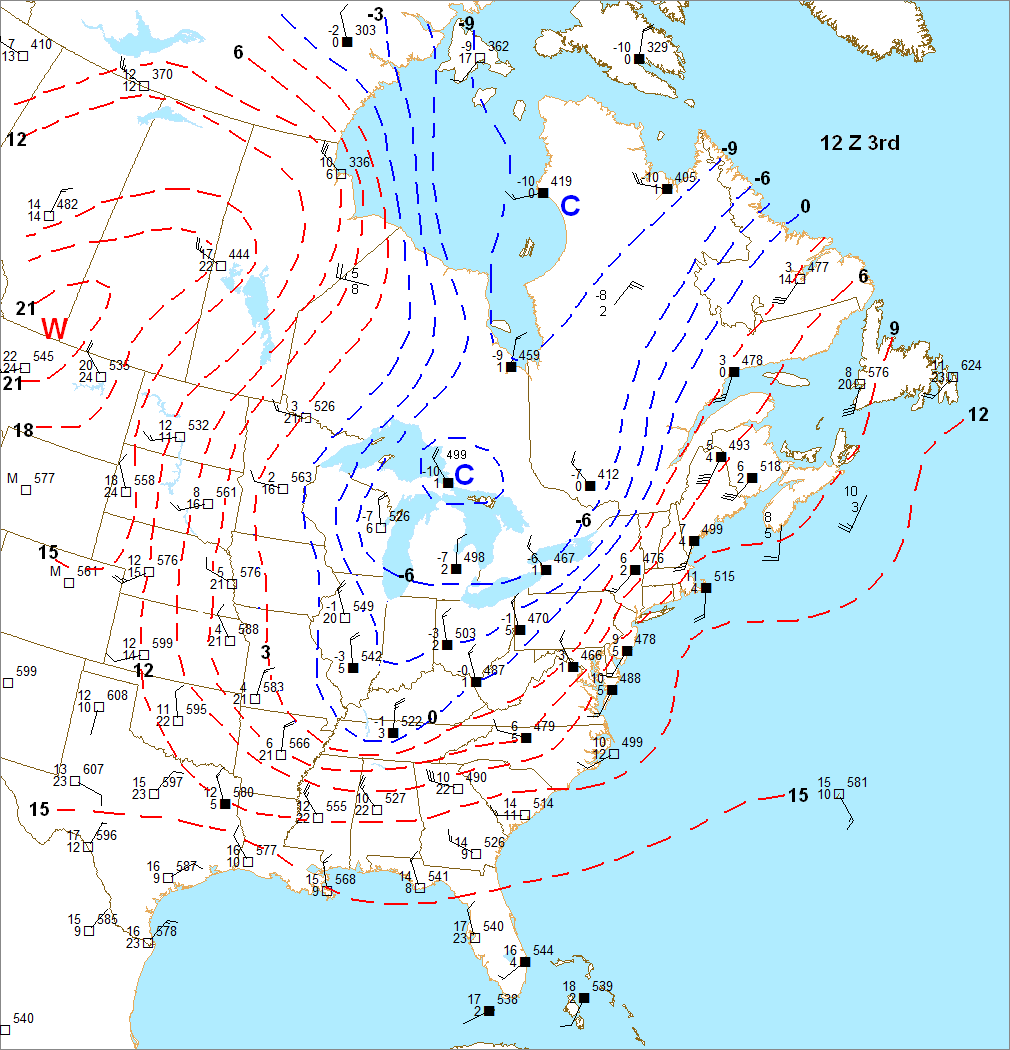
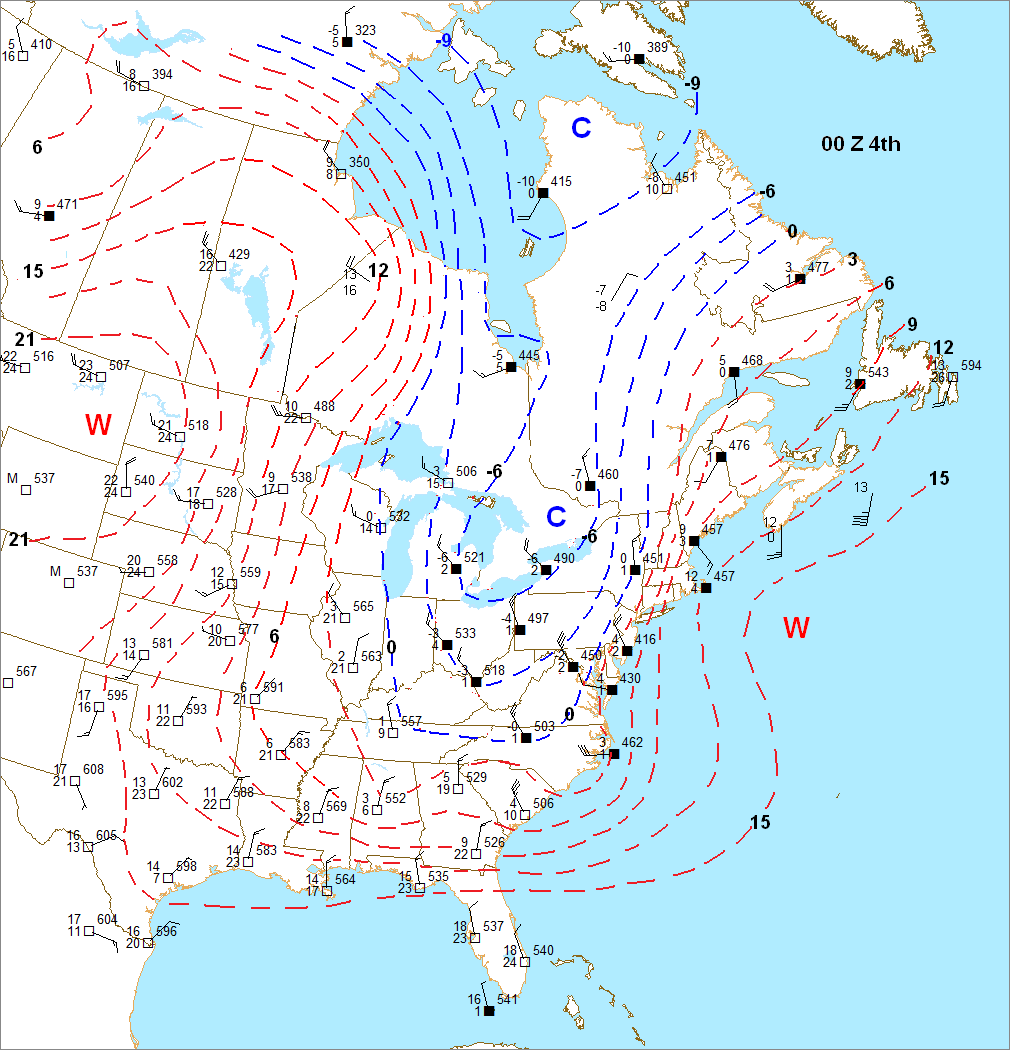
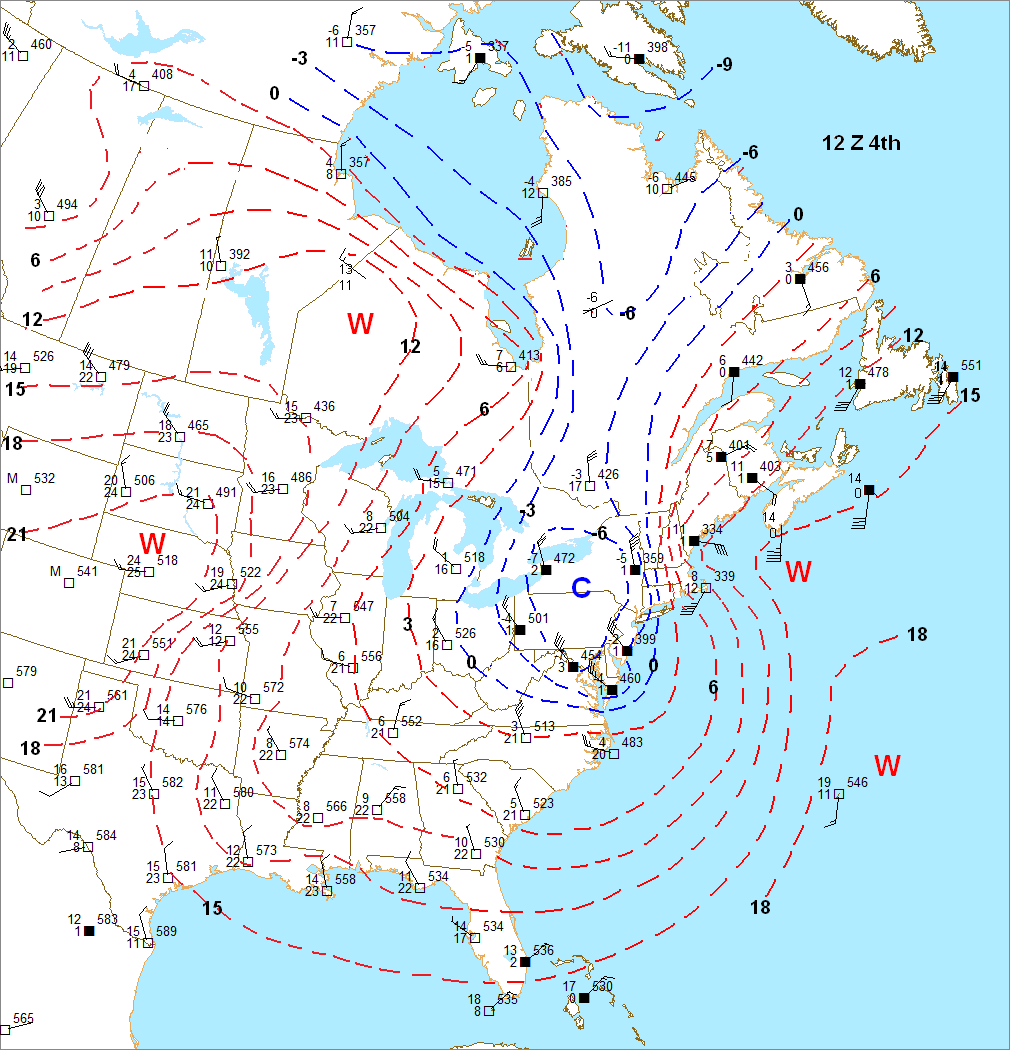
to the beginning stages of baroclinic development. By 12 UT4th the front had swept well off the Middle Atlantic coast, but was still anchored over New England where
cyclogenesis was occurring. The 500mb chart with 850mb features overlayed
shows that the upper low center was now closed and almost coincident
with the 850mb low. This marked the end of the rapid deepening phase of
the low level cyclone. The occlusion process started just after 12
UTC 4th. The entire progression 500mb and 850mb features can be found
in this loop.
Cold
advection obviously played a role in changing the rain to snow in
eastern NY and adjacent states. By 00 UTC 4th, the rain had aready
changed
to heavy wet snow in the Catskill Mountains above 1500 ft. The 00 UTC
850mb chart shows that the 0C line was right through Albany. The 850mb
temperature at 00 UTC over the Catskills was probably around -1C.
However, the precip did not mix with snow in Albany until 07 UTC and
didn't change to snow completely until around 09 UTC. This is because
the elevation of Albany is around 200 ft. So the layer of above
freezing air was just too deep to get snow at the surface. Locations
south of Albany along the Hudson river and just west of the
Hudson river experienced northwest downslope winds off the Catskill
Mountains
throughout the event. This had a warming effect on the low-level
thermal profile and prevented these locations from receiving snow.
However, east of the Hudson River the low-level flow had an upslope
component and the rain changed to heavy snow by 7 UTC east and
northeeast of Poughkeepsie and by 09 UTC further north . Even though
surface temperatures were coldest where it was snowing heavy and
actually warmer
upstream, cold advection was still occurring leading up to the event.
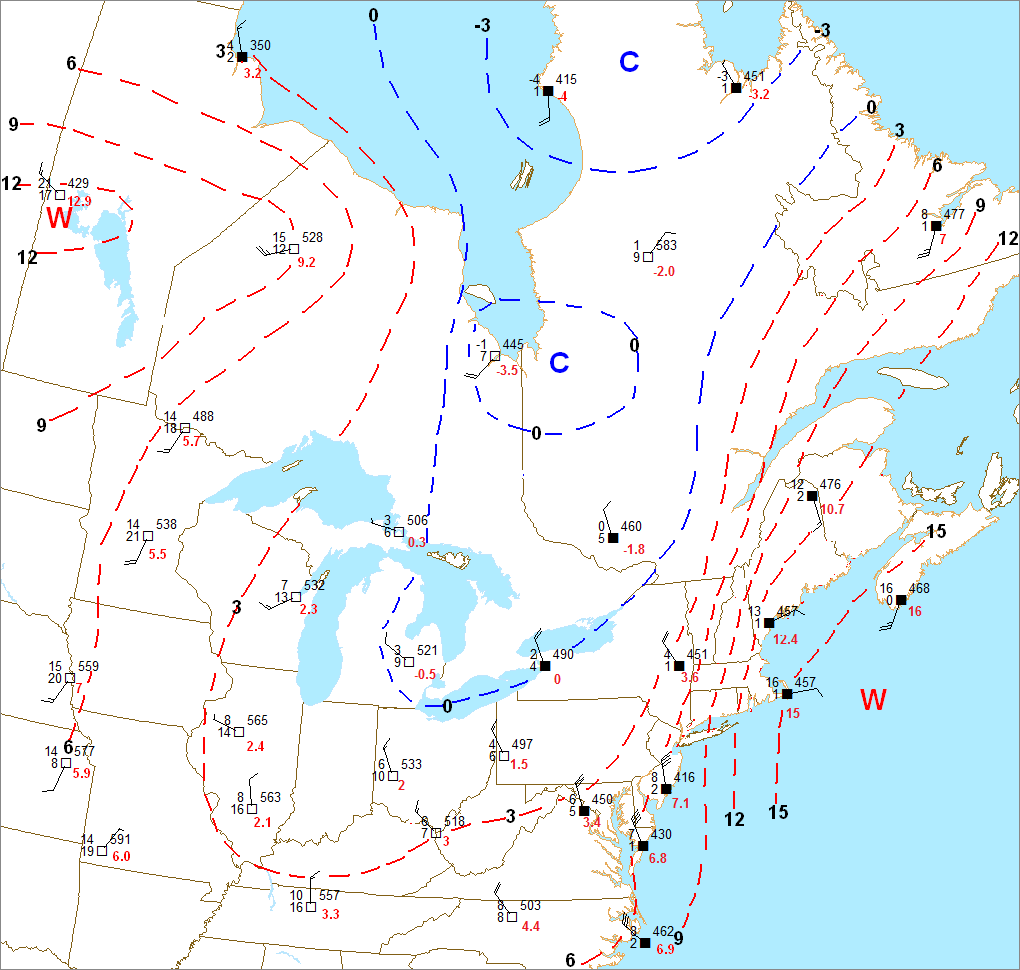
950mb wet bulb temperature values were
analyzed from 12 UTC 3rd to 12 UTC 4th in order to illustrate this. One
can readily see that the low level airmass upstream from Albany was
indeed drier. As this drier and cool air advected southeastward, strong
evaporational cooling, along with strong low to mid-level ascent,
helped cool the low levels and change the precip to snow. At 12 UTC 3rd, the 950mb wet bulb temperature was 7.7C at Albany, +0.6C at
Buffalo, -1.0C at Maniwaki, Quebec, -4.5C at Sault Saint Marie and -4.5C
at Waskaganish, Quebec. Obviously
there was cold advection occuring over upstate NY. By
00 UTC 4th the 950mb wet bulb temperature had dropped to 3.6C at
Albany,
0C at Buffalo, and -1.8C at Maniwaki with continued northwest flow. In fact,
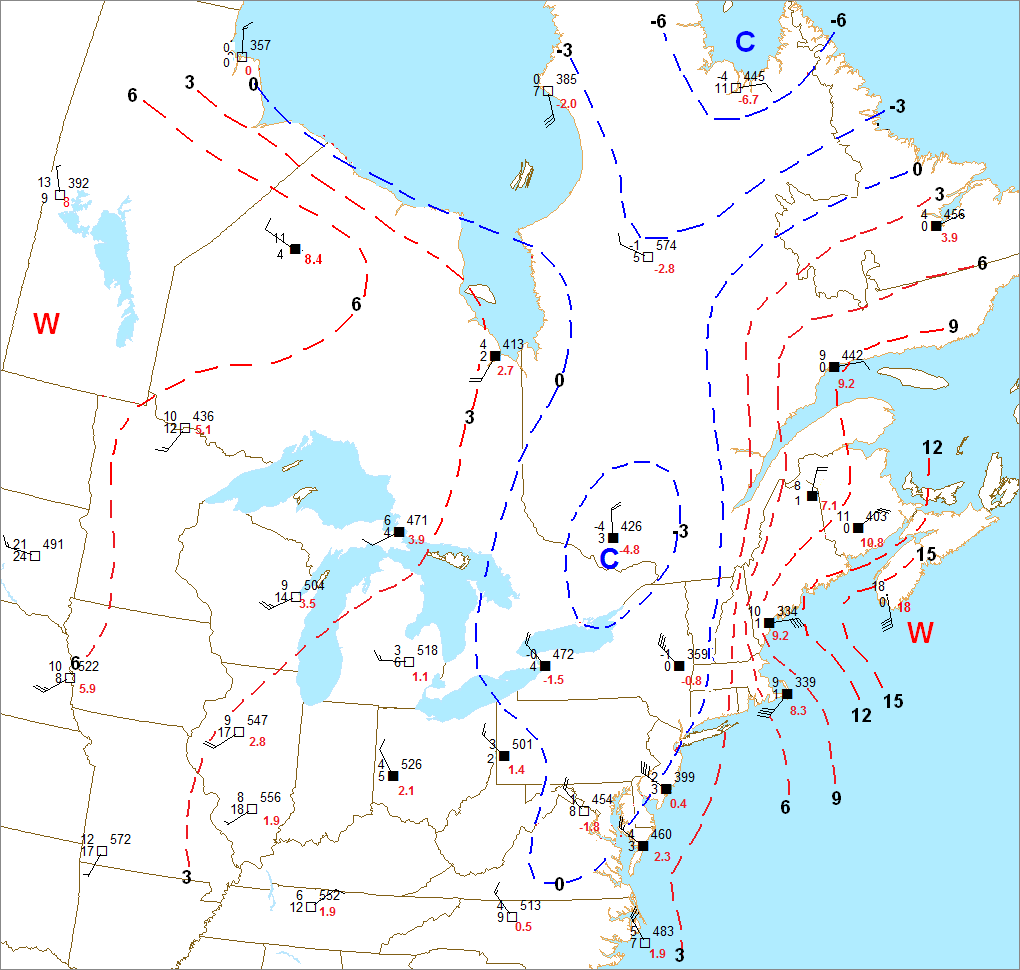
the northwest flow was in the process of increasing dramatically due to low-level cyclogenesis to the southeast. As a
result, the 950mb wet bulb values over eastern NY cooled strongly
between 00 UTC and 12 UTC 4th
and were down to -1C at
Albany, -1.5C at Buffalo, -4.8 at Maniwaki, Quebec and even 0.4 at
Atlantic
City, NJ. The 950mb level was about 1300 ft above Albany at 12
UTC 4th. Since above freezing layer near the
ground must generally be less
than 2,000 ft to get snow, it makes sense that the precip was all snow
at Albany before 12 UTC. It is interesting to note that the rain
changed to
snow in the Poughkeepsie area south of Albany first since the cold
advection cooled the column in this area before if did further north
due the orientation of the low-level isotherms (cold air was sweeping
in behind the system). Sanders and Bosart (1991) proposed that
melting of falling sowflakes through the above freezing layer near the
ground actually cooled the column and was the primary mechanism
in changing the precipitation to snow. It
is impossible to tell which of the 3 processes (cold/dry advection and
subsequent wet-bulbing, lift or melting) played a greater role in
changing the precipitation to snow, but I personally believe based on
the evidence presented above that the former process was very important.