May 22 2008 Tornado
Outbreak
Under Construction(last updated July 6 2008 0200 UTC)
best viewed with 1024 by 768
resolution
Related items of interest
Historical
Tornado Cases for the Cheyenne Warning Area
Detailed
Tornado Cases for the Cheyenne Warning Area
Historical
Tornado Cases for the Boulder Warning Area
Historical
Tornado Cases for the United States
Elevated
Mixed Layer
Elevated
Heating
Overview
of Events
On May 22-23, 2008, a
favorable pattern for severe thunderstorms developed for the high
plains, front range and eastern slopes of
the Rockies. Slow moving meridional troughs have historically
provided some of the more notable severe weather outbreaks for
this region. Examples include
April
23 1960 and
June
14-17 1965.
Several tornadic storms occurred on
May
22, and a few of these produced large and long-lived
tornadoes. The method of counting tornadoes has varied over the
decades. Also, many more tornadoes are spotted since the advent of
storms chasing. These days, some eager storm chasers are reporting
every little dust-whirl that remotely looks like a tornado. To me, the
longevity and quality of individual tornadoes have more meaning than
the actual number of tornado touchdowns. For example, one F4, mile-wide
tornado that stays on the ground for 50 miles obviously is much more
significant than 50 tiny, weak tornadoes that stay on the ground for 30
seconds and do little damage. In the 1950s, individual paths of
tornadoes tended to be much shorter because detailed storm surveys were
usually not done. In reality, these continuous tracks were oftentimes a
family of tornadoes, with breaks in between the individual tornadoes.
Also, one tornado on the ground continuously for 50 miles obviously
does more damage on average than a family of 10 tornadoes along the
exact same path. The tornado on March 18, 1925 is officially listed an
one continuous tornado for 234 miles that killed 695 people.
Obviously this was a
catastrophic
tornado day in our history.
This severe weather episode was well forecasted by the ECMWF model.
This model indicated that a deep,
slow moving, meridional trough would approach the
high plains on May 22-23. It also predicted a deep trough over New
England, with an associated surface front behind this system
through the lower midwest into northeast Kansas, southwest
Nebraska and eastern Wyoming. The ECMWF did an excellent job
with these features well in advance. The 144 hr ECMWF showed a
stationary front through northern Kansas and southern Nebraska, with
strong upslope flow across western Nebraska and eastern
Wyoming. On May 17, I expressed my
thoughts
about the
severe
weather pattern.
A tornado watch
was issued by the storm prediction center at 1725 UTC (1125 am MDT) for
much of northeast Colorado and part of southeast
Wyoming.
Towering cumulus clouds developed southeast of Denver International
Airport around 16 UTC on May 22. By 1635 UTC, 45 dbz echoes
were noted at 23,000 ft about 3 miles northeast of the
airport. By 1657 UTC, a 61 dbz echo was located 14 miles
north of Denver at 21,000ft. The first 50 dbz on the lowest slice
occurred at 1648 UTC. The first 60 dbz echo on the lowest slice was
noted 5 miles west-southwest of Hudson at 1652 UTC. By 1701 UTC there
was a 62 dbz echo up to 26,000ft and 47 dbz echo up
to 32,000ft. The storm was severe at this point. At 1705 UTC, the storm
had 63-66 dbz echoes northwest and west of Hudson at
the lowest slice.
Radar loops for the
Colorado part of this tornado outbreak will be coming soon.
It is well known that
thunderstorms tend to develop along the front range earlier than on the
low plains. This is because capping tends to be weaker due to elevated
heating, and lower moisture content of the air allows for
a rapid warmup to the convective temperature by local
noon. Also, the Laramie Ridge is above the traditional capping level.
But convection began before local noon on this day. The first
tornado report was east of Platteville at 1726 UTC. The
tornado was already doing damage by 1726 UTC and was reported
to be 1/2 mile wide at 1727 UTC. This tornado became
very
large and damaging and continued for 34 miles to
west of Wellington, CO through 1812 UTC. Very large hail up to
baseball size occurred along and west of the tornado path. The
tornado moved generally to the north-northwest at 35 to 40
mph.
The storm weakened a
little as it moved northwest of Wellington, CO, but then strengthened
and accelerated as it passed east of Virginia
Dale. This storm produced a 2nd tornado from 1857 UTC to 1935
UTC. There may have been a break in the damage northwest of
Overlook Rd after 1922 UTC. This tornado was accompanied by
quarter to golfball sized hail. It is unclear whether the
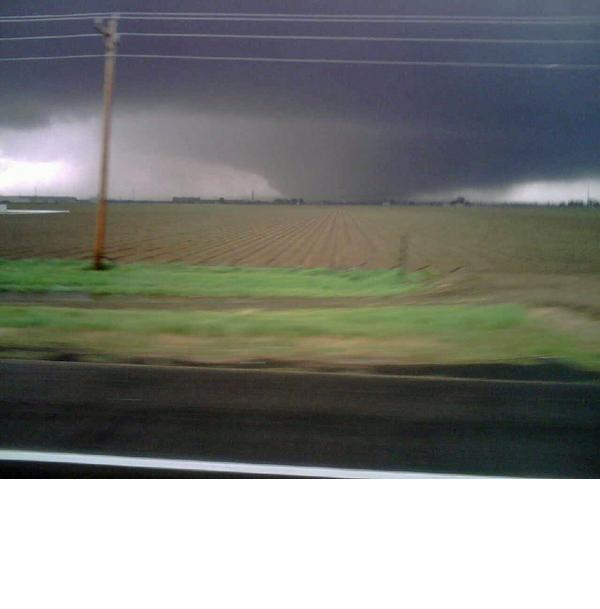
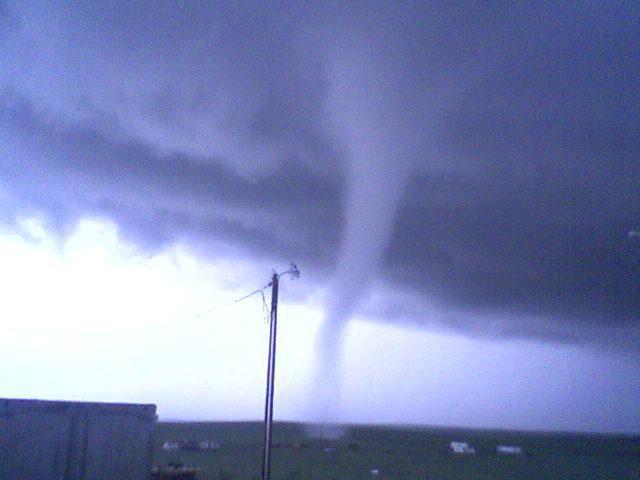
tornado
that hit Laramie was a 3rd tornado from the same supercell
or whether the 2nd tornado continued into Laramie. The tornado
in the picture looks very small. It is more probable that the tornado
shrunk in size just before entering the eastern edge
of Laramie. The tornadic storm continued well northwest of
Laramie. Radar indicated another possible tornado
7 miles north of Harper, WY at 2017 UTC.
Since I have a strong
interest in high elevation severe weather, and since this was a
particularly rare and exceptional tornado event on the high terrain, I
decided to independently document the Wyoming part of the tornado
outbreak. This was accomplished using the internet
white pages
along with
live maps.
But when I first started this task, I had no names
to work with. So I ordered a phone book for Cheyenne, WY called the
"Country Cowboy". I started with the H's, and after about 5
minutes I found the name Paul Hansellman on Ramshorn
Road. Ramshorn Road was close to the tornado
path. So I called Paul Hansellman. This immediately paid off as his
house was unfortunately hit by the tornado. He gave
me 2 other names and then those people referred me to others. So
information piled up quickly. I want to thank all
those
who took the time to share information over the phone.
The 1st and strongest
Albany county tornado touched down about 0.4 miles east of the
intersection of Albany, Larimer and Laramie counties, or about
3/4 mile west of Harriman road along the state line(elevation 7500 ft)
at 1857 UTC (1257 pm MDT). Prior to the tornado, dense fog
shrouded the eastern slopes of the Laramie
mountains, with visibilities almost zero at the Walno residence
near the tri-county border. Wylie
Walno arrived home just before the storm
hit the area. He said that the visibility suddenly jumped from
near zero to unlimited as the storm passed to his
north. He could see low-hanging clouds pass by. Golfball sized hail
also occurred at the Walno residence. The first signs of
tornado damage occurred at the residence of Richard Miller. Two trees
on his property were downed and his garage door was bent. Half dollar
sized hail also occurred there. Immediately to the northwest, 20
ponderosa pine trees were downed on the Claire Hoover farm as
the tornado passed in between the house and a barn. Then the
tornado toppled 4 more trees on Belinda Scott's property. A few trees
were downed on Wylie Walno's property on the periphery of the tornado.
Storm
relative velocity loop (1845 to 1934 UTC)
Reflectivity
loop (1845 to 1930 UTC)
Fairly extensive
tree damage occurred just northwest of the initial
touchdown location as the tornado widened. Peter Hansen
reported to me that the tornado downed trees for
several miles on his property. Tim Warfield told me that
there was extensive tree damage on his land. By 1904 UTC the tornado
was over 1/4 mile wide and was climbing up the Laramie Ridge to 8000ft.
Very old pine trees 3 to 4 ft. in diameter were mowed
down by the tornado. Tom Nowak, Jim Price and another
person were putting fish into Imson Pond in the dense fog
with visibilities near 100ft. Quarter to ping-pong ball sized
hail chased them to their trucks. This is a good thing since they were
then hit by the tornado around 1908 UTC. They described a frightening
experience. The tornado buffeted their vehicles. One truck
contained a 1000 lb fish tank. This truck rocked back and
forth by the tornado and most of the windows were smashed out.
Another truck was actually lifted off the ground and set back down,
with windows knocked out as well. A camper shell was broken
off one of the trucks and flung 1/2 mile to the south. Debris was
flying everywhere during the tornado including picnic tables.
Large trees were downed on both sides of the road near the
pond.
Immediately after
leaving the pond, the tornado hit on Ramshord Rd. Ted Lewis measured
153 mph winds on his Davis Monitor 2. His house faired fairly
well even though huge pines were blown down. A 12 ft aluminum
boat was blown 500 yds. The tornado then hit the Paul Hanselmann house
also on Ramshorn Rd. The front half of his roof was blown off, with
pieces of it found over 2 miles away. The back part
of the roof was heavily damaged. The Hanselmann house was well
constructed with concrete-filed styrafoam and was reinforced
with steel rebar anchored to the foundation.
After leaving the
Hanselmann house, the tornado moved over very rural territory for
several miles. But there was a continuous damage path
all the way northwest to Overlook Rd, with trees and fences downed all
along the .6 to .9 mile wide path according to Bob Adams who documented
the tornado path. Along this path the tornado climbed in elevation to
8500ft. Major damage occurred on West Vedauwoo road. The Gayle Wilson
house was destroyed by the tornado. The roof was taken off
and the walls collapsed. 2X4's from her roof were embedded in
the ground several feet. She told me this
was quite an accomplishment since the ground is so
hard(gravel-like) that it is difficult to even dig a shovel into it.
She also reported that nails from her roof were embedded the
wrong way into fence posts 500 yds away at another residence. Ping-pong
to golfball sized hail occurred on Overlook Road and Howe Lane. A grove
of pines was downed by the tornado on Overlook Rd. The Harriman-Laramie
tornado path was continuous for 18 miles from west of Harriman
to north of Overlook Rd, and possibly for 31 miles to north of Laramie.
There is a mountainous area between Overlook Rd and Laramie where no
people live. Bob Adams told me that the
continuous path seems to have ended beyond Overlook Rd. I am
not sure if it will ever be determined whether the tornado
continued all the way to Laramie continuously.
A tornado moved across
I-80 southeast
of Laramie around 1928 UTC, and then across the far eastern and
northeastern part of Laramie between 1930 and 1935 UTC. F1
damage
was done to many structures. I did not independently document
the
Laramie segment of the tornado. A quick internet search
revealed
the following damage:
Numerous homes damaged
Church damaged
Dance hall damaged
College of Agriculture greenhouse facilities damaged (5 of 18
greenhouses damaged and the hoophouse greenhouse destroyed)
Storage shed and wooden pole barn were destroyed near the greenhouses.
Huge pieces of the barn were carried 250 yds.
10 large spruce trees were either uprooted of snapped in half at the
greenhouse facilities
Many trees were snapped in half or uprooted at the Jacoby golf course
The tornadic storm continued to the north-northwest
through central and northern Albany county. No tornado
damage occurred, but this area is
very rural. Given the fog, it is possible that
tornadoes went unreported.
The Harriman-Laramie tornado moved to the north-northwest at an average
speed of 47 to 50 mph. The heading of the tornado was 320
degrees at the beginning of the path and 330 degrees toward the end.
This was an exceptionally fast moving tornado by
Wyoming standards. Typically the mid level (600-300mb) flow
over southeast Wyoming is fairly weak in tornadic situations,
hence strong right-movement and slow storm motion (10 to 30 mph). The
fast storm motion on May 22 is more typical of the southeastern United
States in winter or early spring. The storm accelerated as
it climbed closer to the strong mid level flow. Basically, the
storm was closer to the strong mid level winds after it climbed to
7500ft. As previously mentioned, the tornadoes on this day moved to the
northwest and north-northwest. This is unusual, but
certainly unprecedented. The April 23, 1960 tornado moved to
the north-northwest.
A small tornado
apparently touched down 3 miles south of I-80 on Harriman Road a little
later in the afternoon from another storm. This tornado moved
to the north-northwest and downed trees in several locations. Several
trees were downed 3 miles south of I80 on Harriman Rd on the William
Prince property with this storm. They estimated winds up to 80 mph. An
old log cabin was extensively damaged on Crystal Lake
Road, with the roof blown across the road. This tornado continued
north-northwest. A few trees were downed and shingles were torn off of
a house. A heavy camper was turned upside down. This damage occurred
about 4 miles east-northeast of Buford. Residents described this event
as a mini-tornado. The tornado most likely started around 2120
UTC (320 pm MDT) and ended about 2137 UTC based on radar. This
storm was not as strong as the Harriman-Laramie storm, but still
containted dime sized hail that was blowing horizontally at
the William Prince residence. The southern end of the storm was
centered just east of Wellington, CO at 2038 UTC, 6
miles east of Harriman at 2108 UTC, 3 miles west of
Granite at 2129 UTC and 4 miles west-northwest of Granite at
2137 UTC. The area southeast of Granite to east of
Harriman is completely devoid of people. It is possible that
tornadoes occurred earlier with this storm.
The path of this tornado
was very close to the path of the
April
23, 1960 tornado. It appears that the 1960 tornado path was
about 1 to 2 miles west of this
tornado, and about 4 to 7 miles east of the
Harriman-Laramie tornado. I drew the path of the 1960 tornado in 2000
with the help of Walter Ferguson whose family has resided in the local
area for several generations.
According to Wylie
Walno, another tornado apparently destroyed a barn 4 miles
west of the tri-county border. Hail accumulated to a foot deep
in this area and took 3 days to melt. I am
still trying to confirm this tornado but the area is very sparsely
populated. The same storm produced large amounts of hail west
of Virginia Dale. This center of the storm was located 5 miles
southeast of Virginia Dale at 2012 UTC, from Virginia Dale
to 4 miles northwest of Virginia Dale at 2025
UTC, 4.5 miles northwest of Virginia Dale
at 2029 UTC (6 to 8 miles west of Harriman) and 1.5 miles east
of Tie Siding at 2038 UTC.
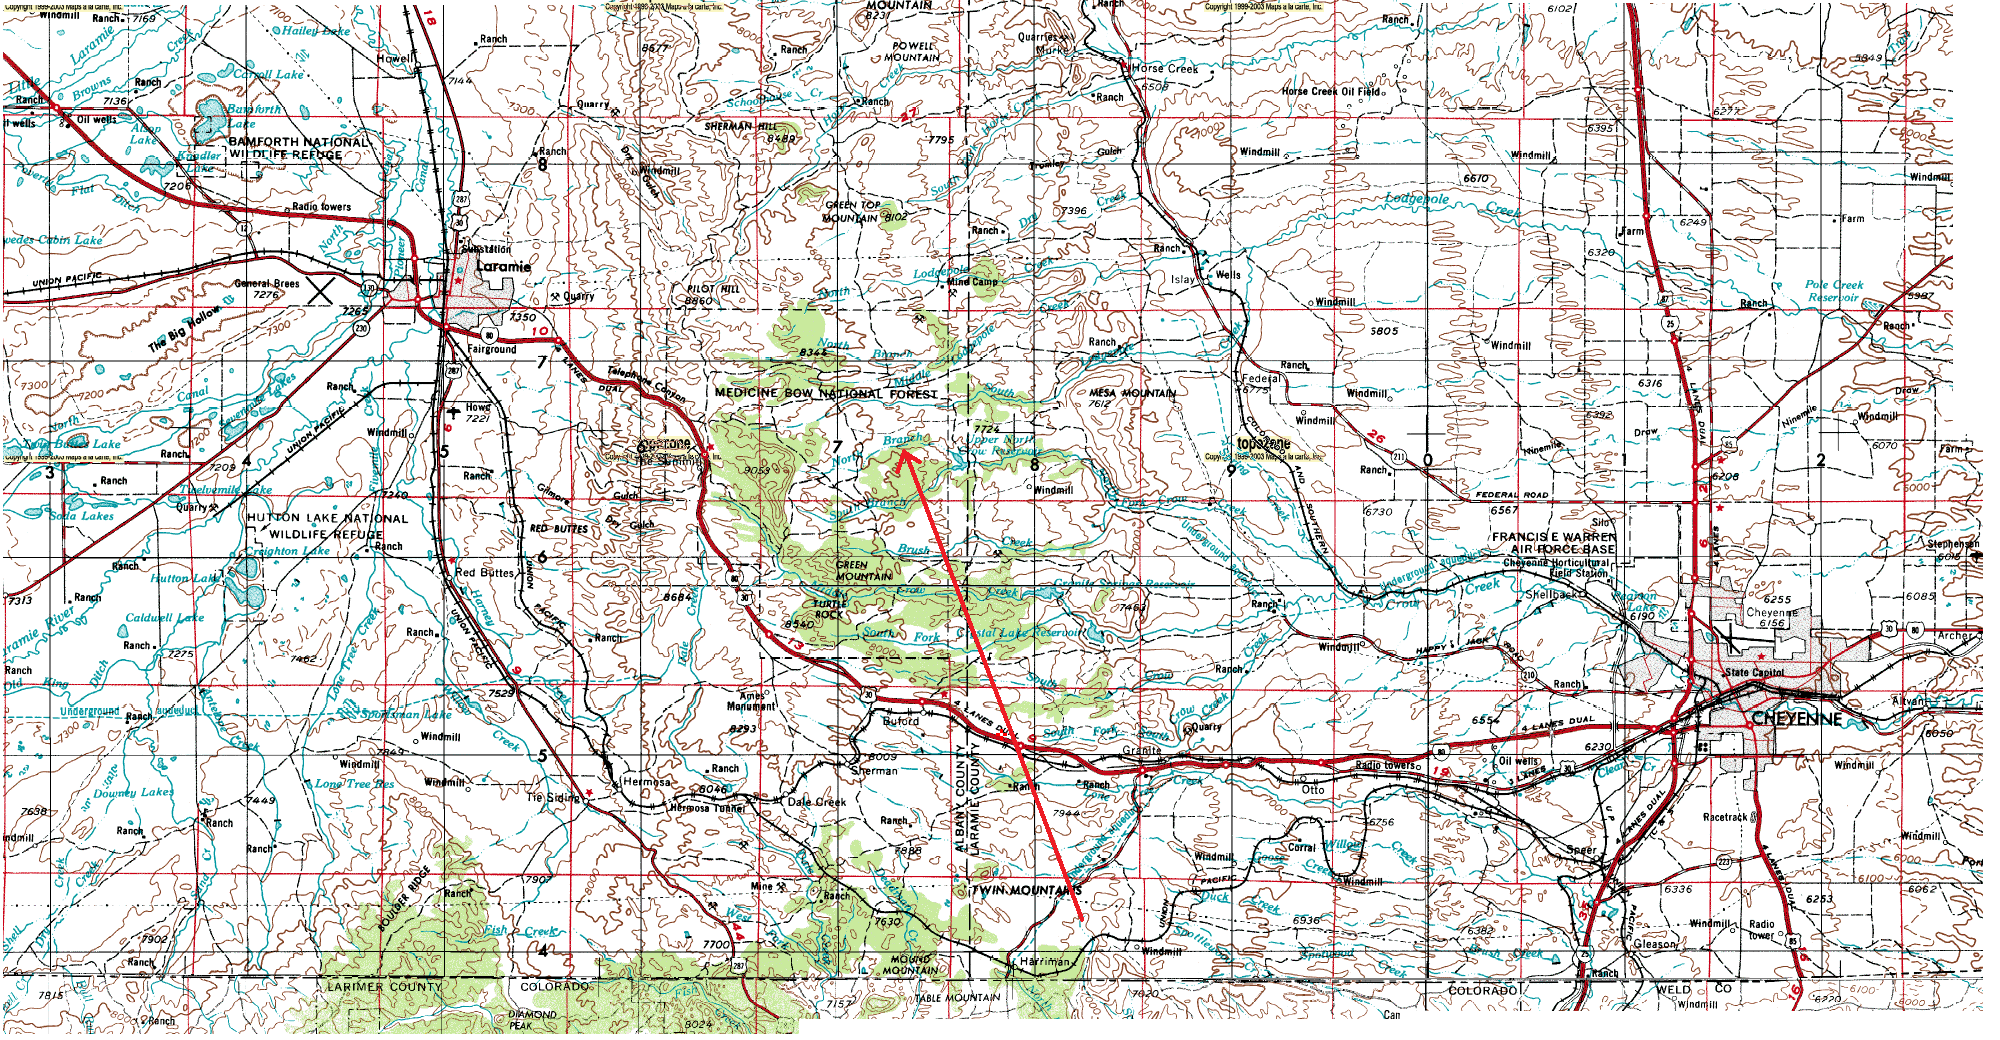
A terrain map
with the Windsor and Harriman-Laramie
tornado paths can be found
here.
A more zoomed in version can be found
here.
A terrain map with both Wyoming tornadoes plotted is
here.
The possible tornado that occurred several miles west of Harriman is
not plotted here. Wylie Walno reported to me that there may have been
another tornado that destroyed a barn about 4 miles west of his
house(or about 5 miles west of Harriman). Interestingly, a severe storm
did move along US-287 from west of Virginia Dale to 5-8 miles
west of Harriman to just east of Tie Siding. But there is just not
enough information thus far about this event to plot a damage
path.
Meteorological
Discussion
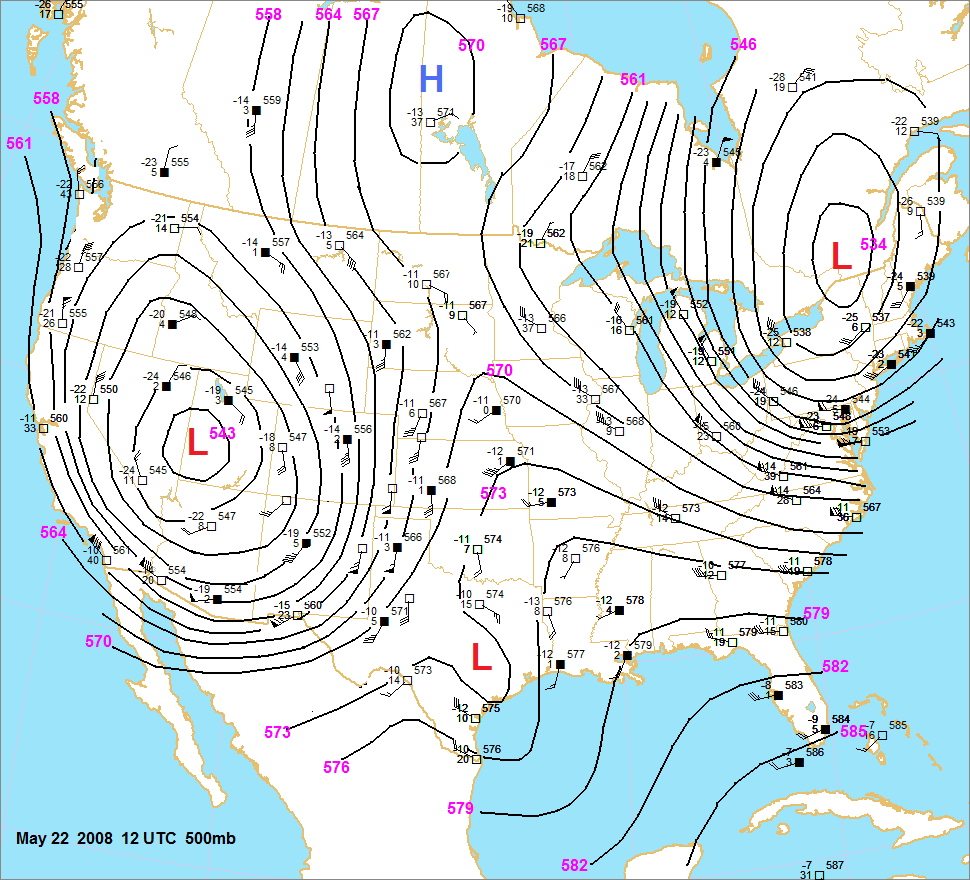
A deep upper trough was
digging into the intermountain west at
00
UTC May 22, 2008. 500mb winds of 100 kts on the back side of
this trough were indicative of a deepening system. The 500mb height in
the center of the upper low was 550 dm over central UT. The
surface
chart at 00 UTC showed a surface front stretching from
central LA into north TX and then into northeast NM and
eastern Colorado. Only marginal moisture was in place across western
Kansas with surface dewpoints in the 50-55F range. However, rich
moisture in the Red River Valley of southern Oklahoma and north Texas
was poised to make a fast return.
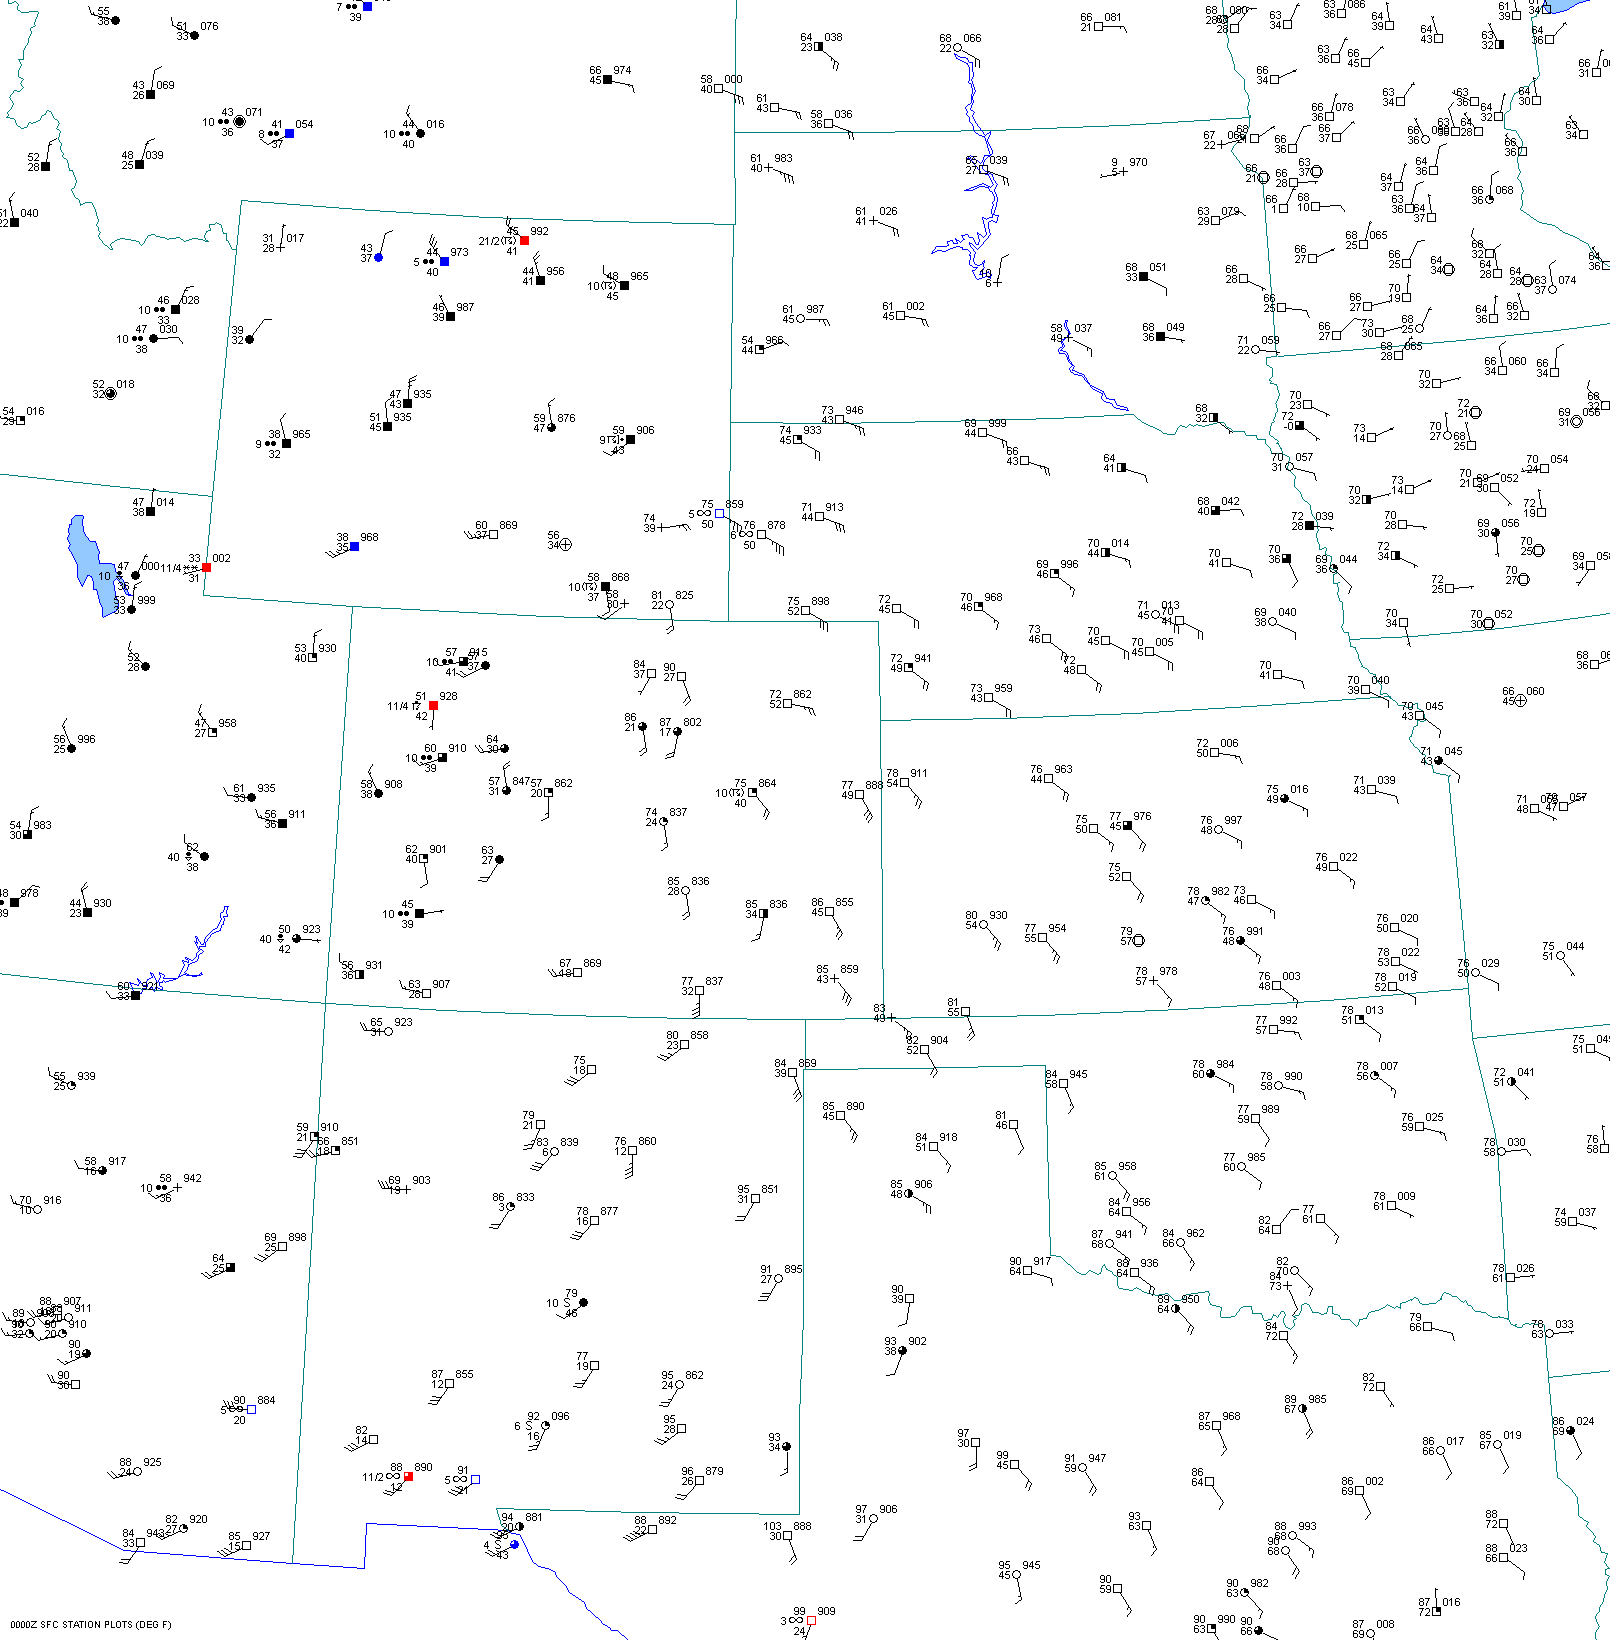
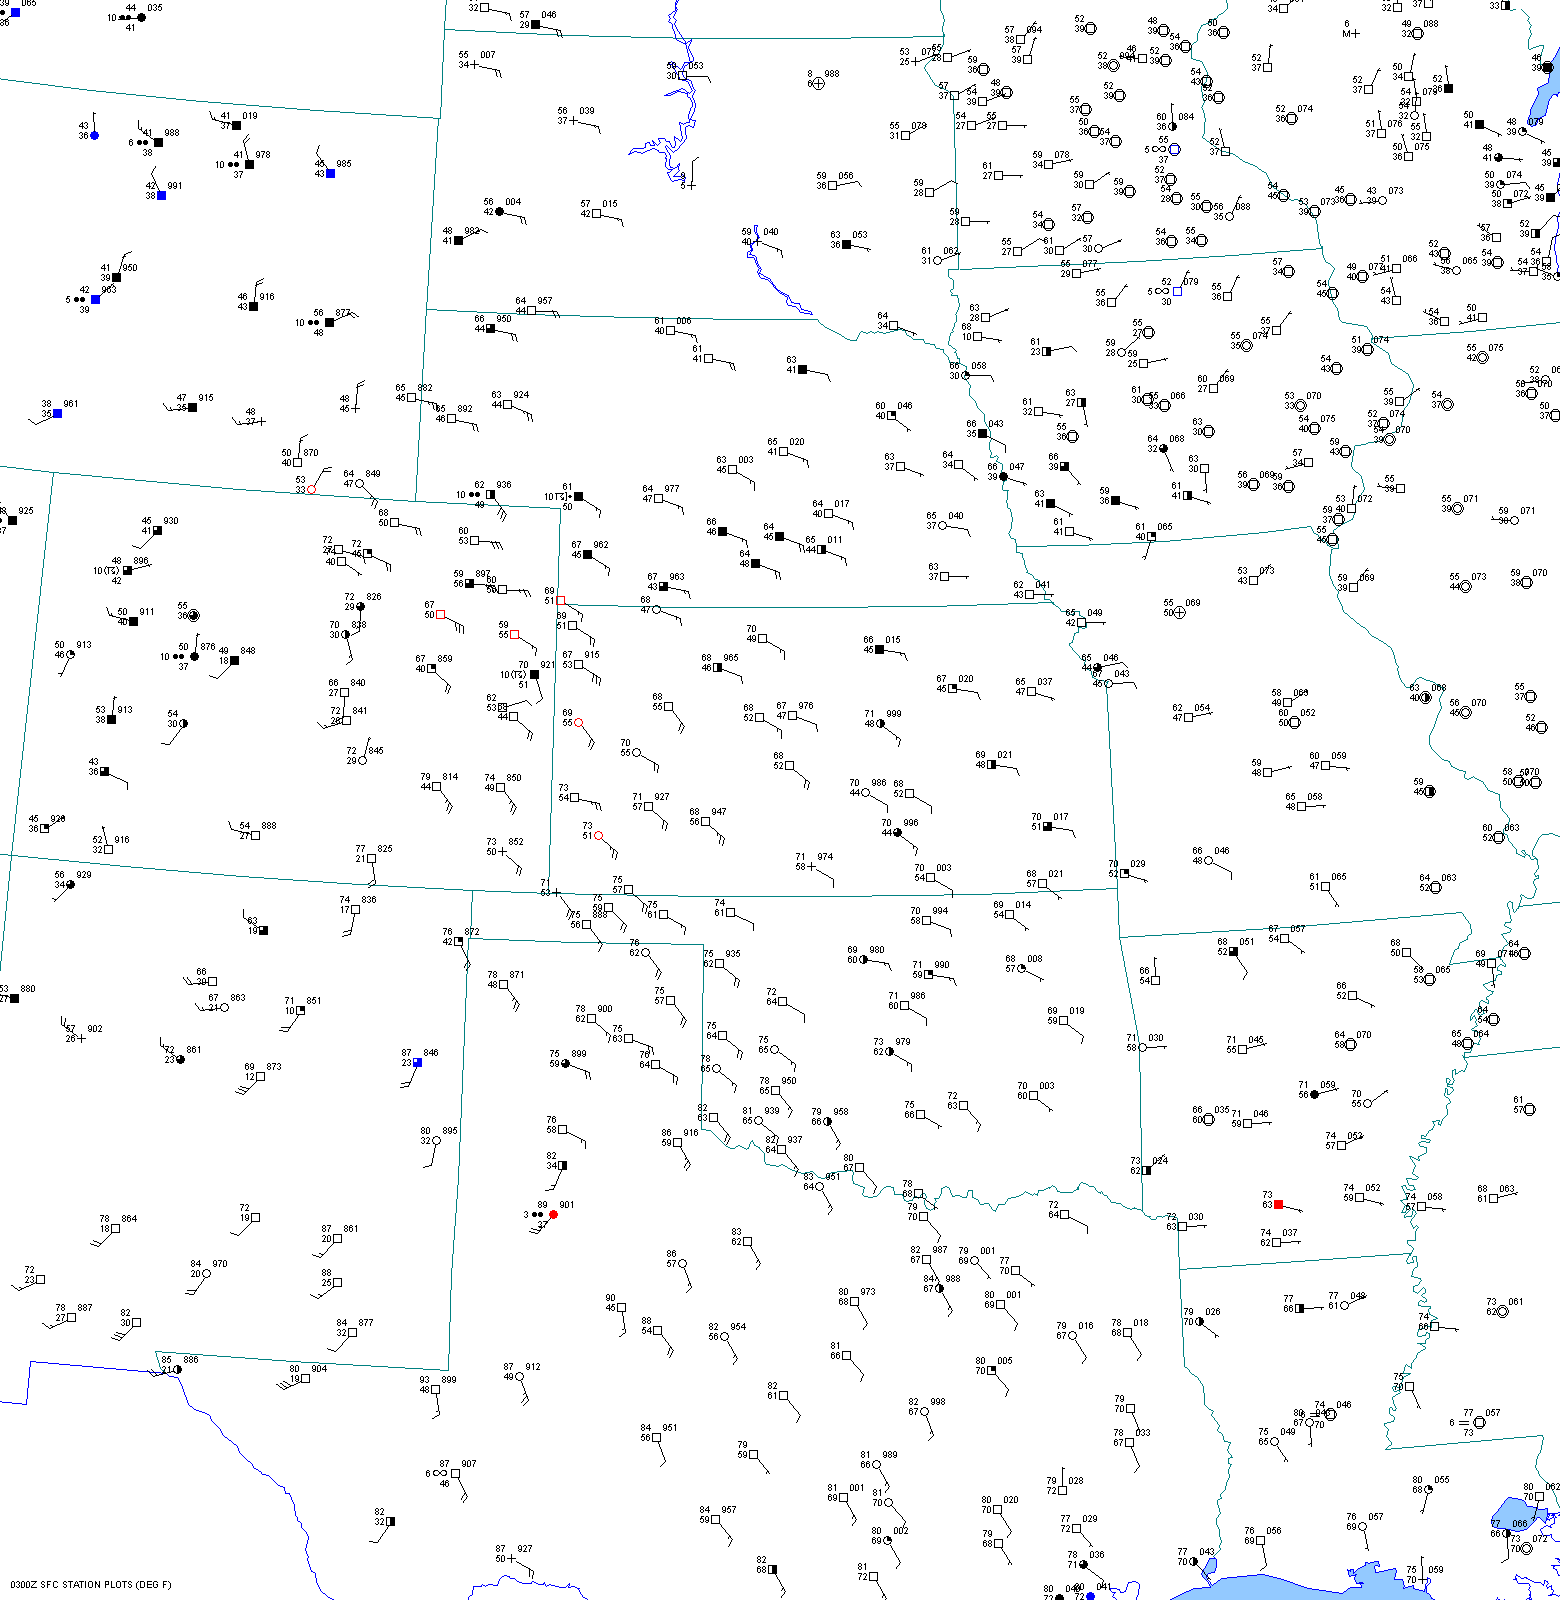
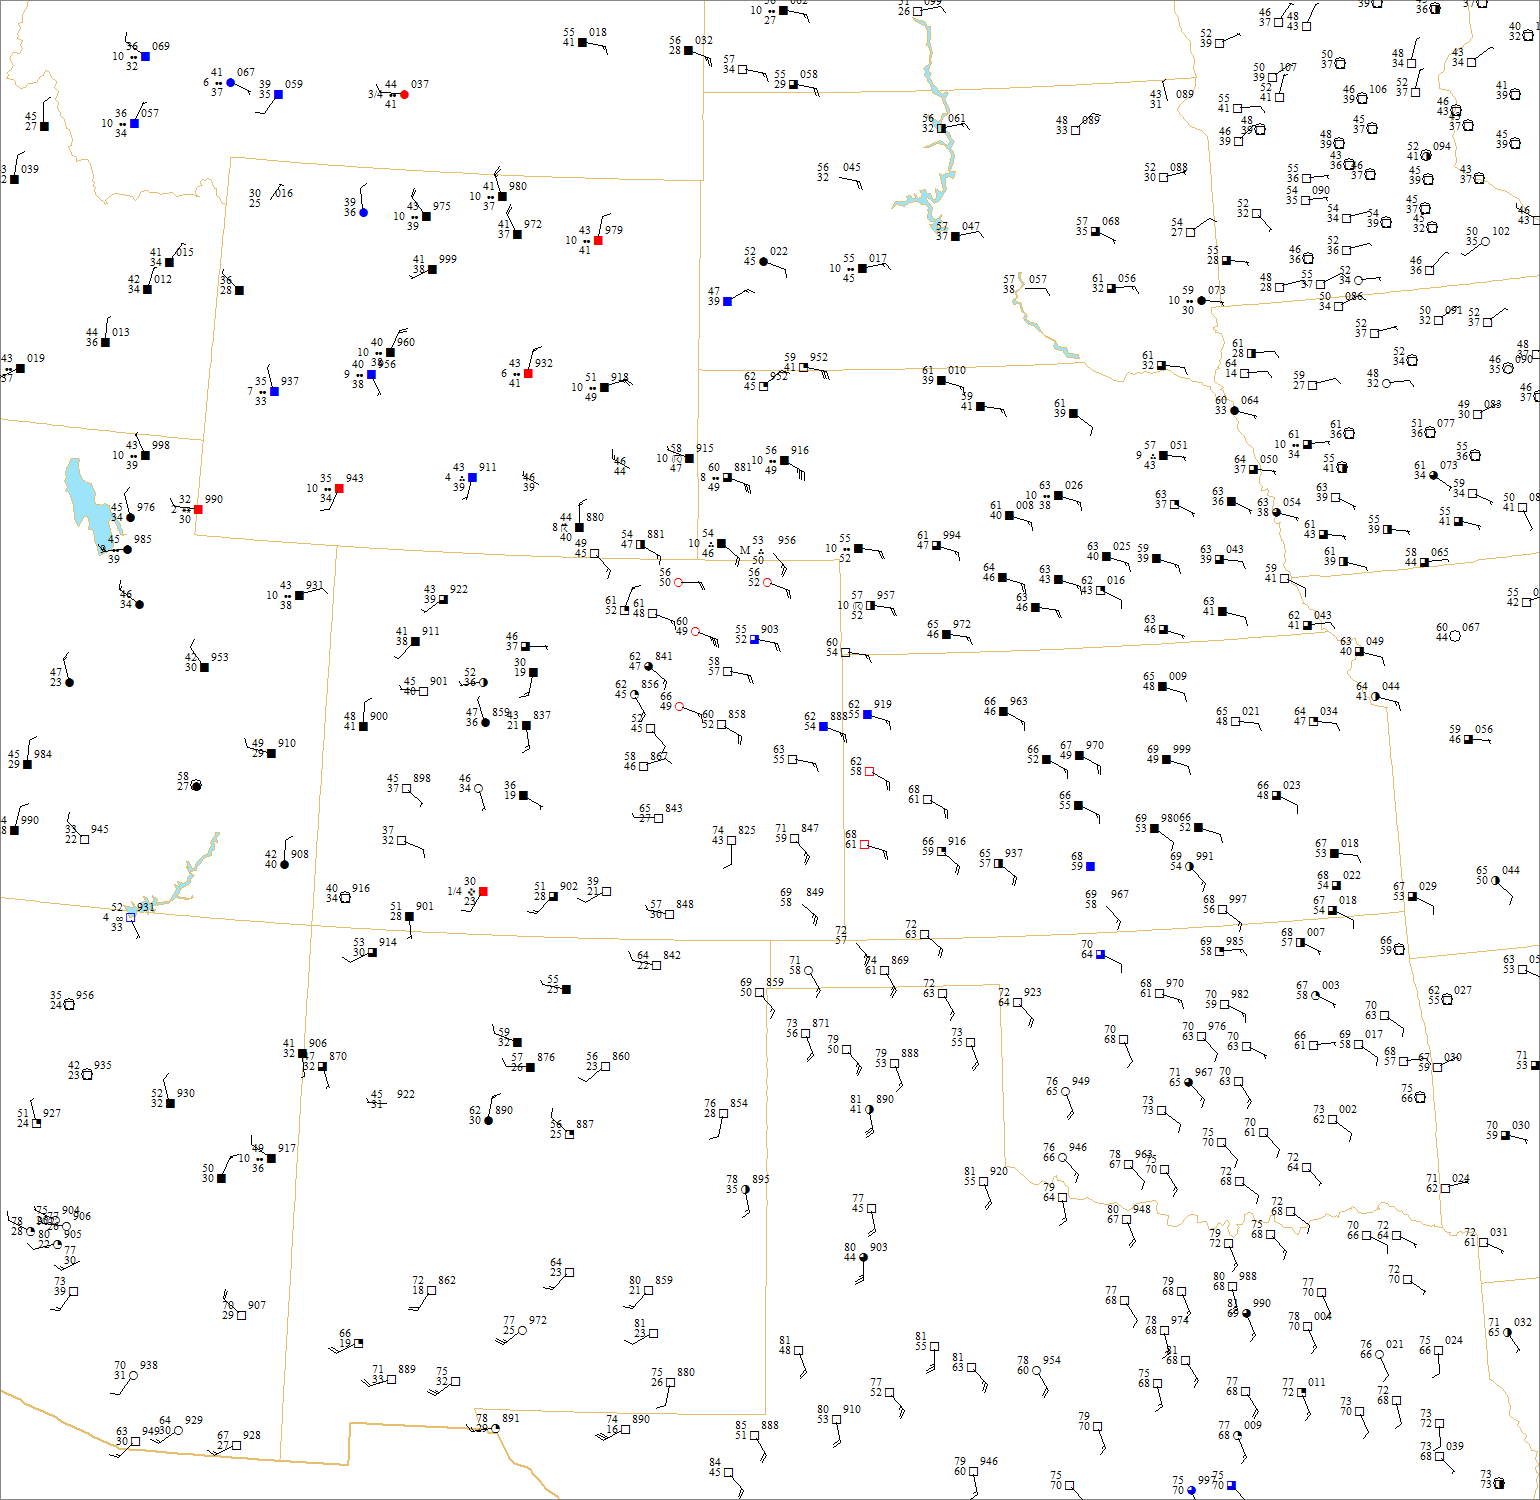
The
03,
06, 09 and
12
UTC surface charts show a strong surge of moisture through
western Oklahoma, western Kansas and eventually eastern
Colorado. By 03 UTC, 60-65F dewpoints were surging through northwest
Oklahoma and into the eastern Oklahoma panhandle. In fact by
06
UTC, 55-60F surface dewpoints were already surging into
eastern Colorado. By 09 UTC, the dewpoint at Limon, CO was up
to 58F, with 53-55F dewpoints along the front range of
northern Colorado. Limon reported overcast skies at 1800ft,
which indicates the low level moisture was at least 1800ft deep.
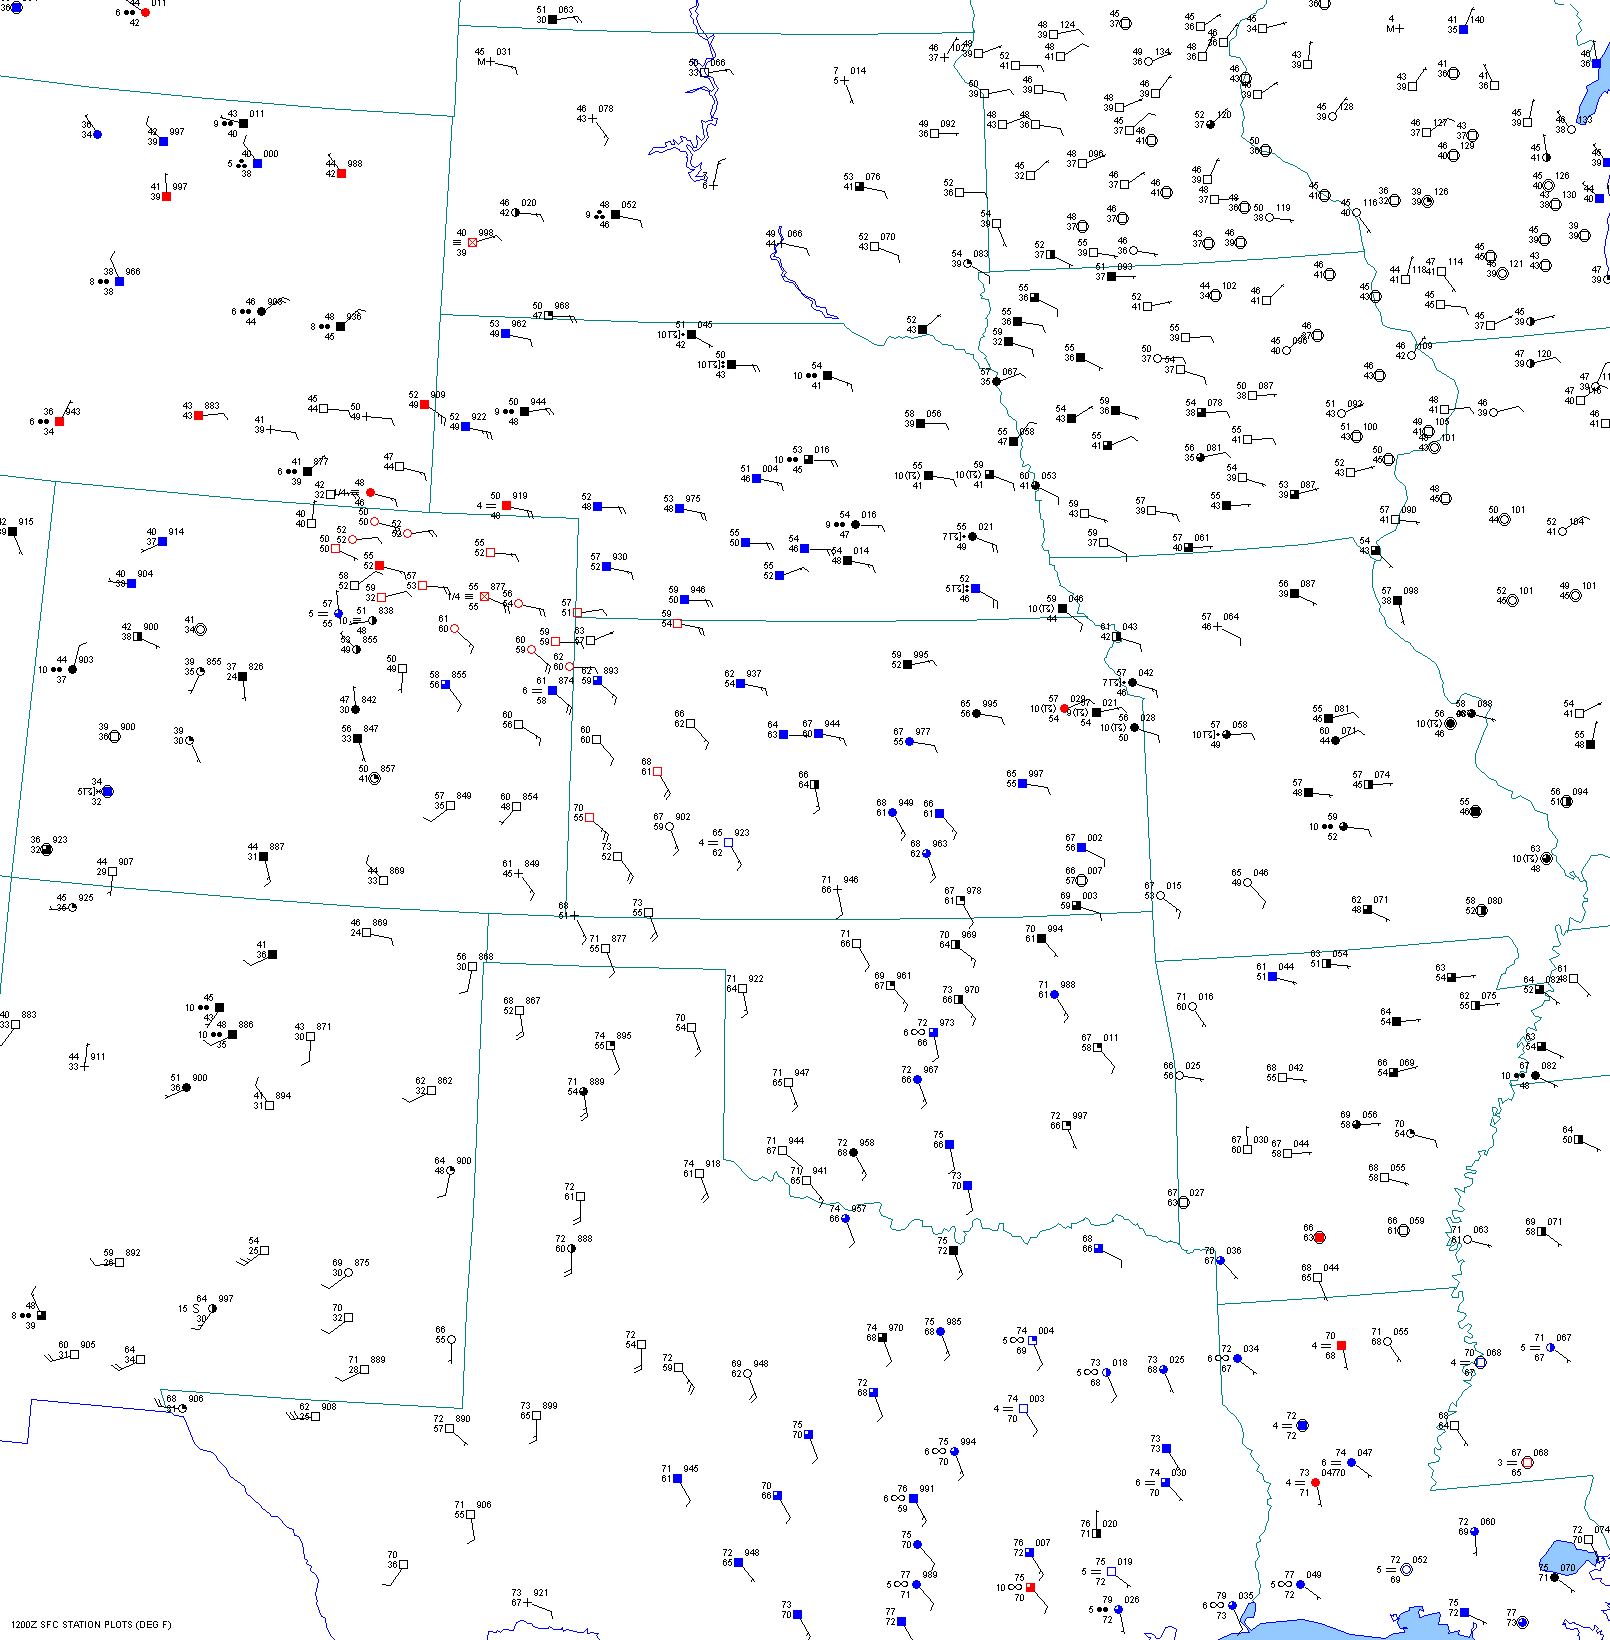
By
12
UTC the moist axis was located from southwest Kansas into
eastern and northern Colorado and had shifted a little to the northeast
since 09 UTC. The 12 UTC 500mb chart indicated strong cooling since 00
UTC. The
500mb
temperature was down to -14C at Denver. The pacific cold front had
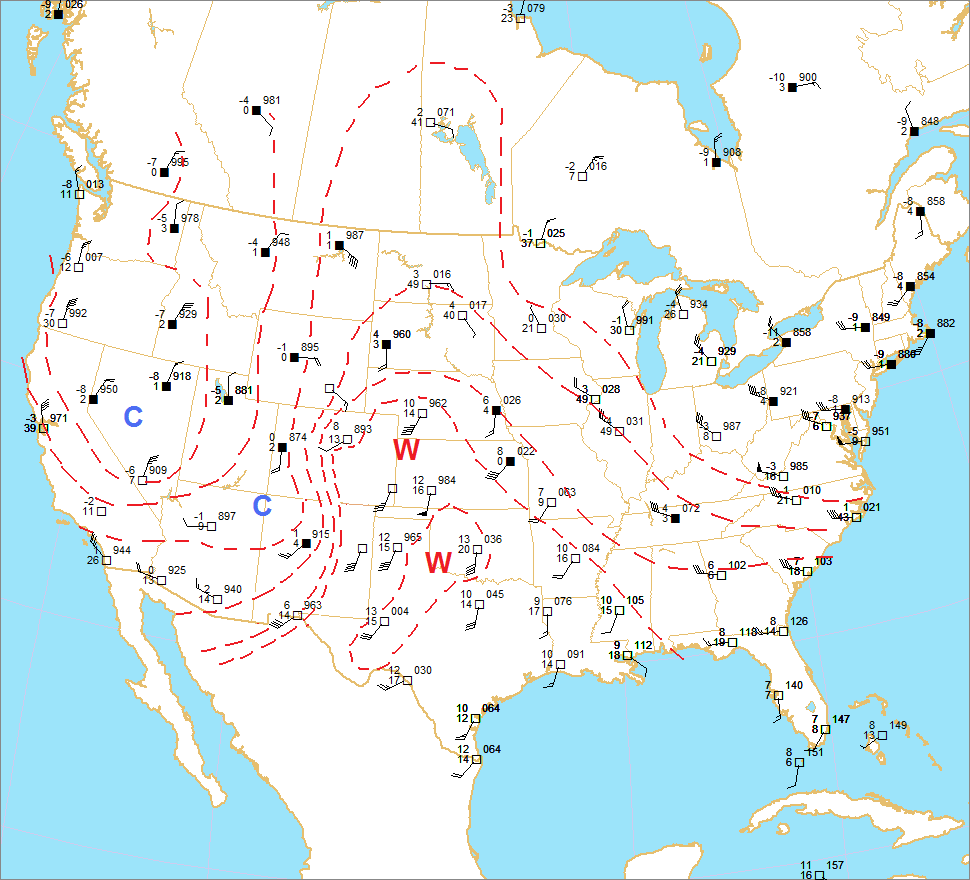
already progressed through Albuquerque as seen on the
700mb
chart. The 700mb temperature was down to -1C at Albuquerque. Mid level
cooling had obviously occurred even ahead of the front across the
plains and at Denver.
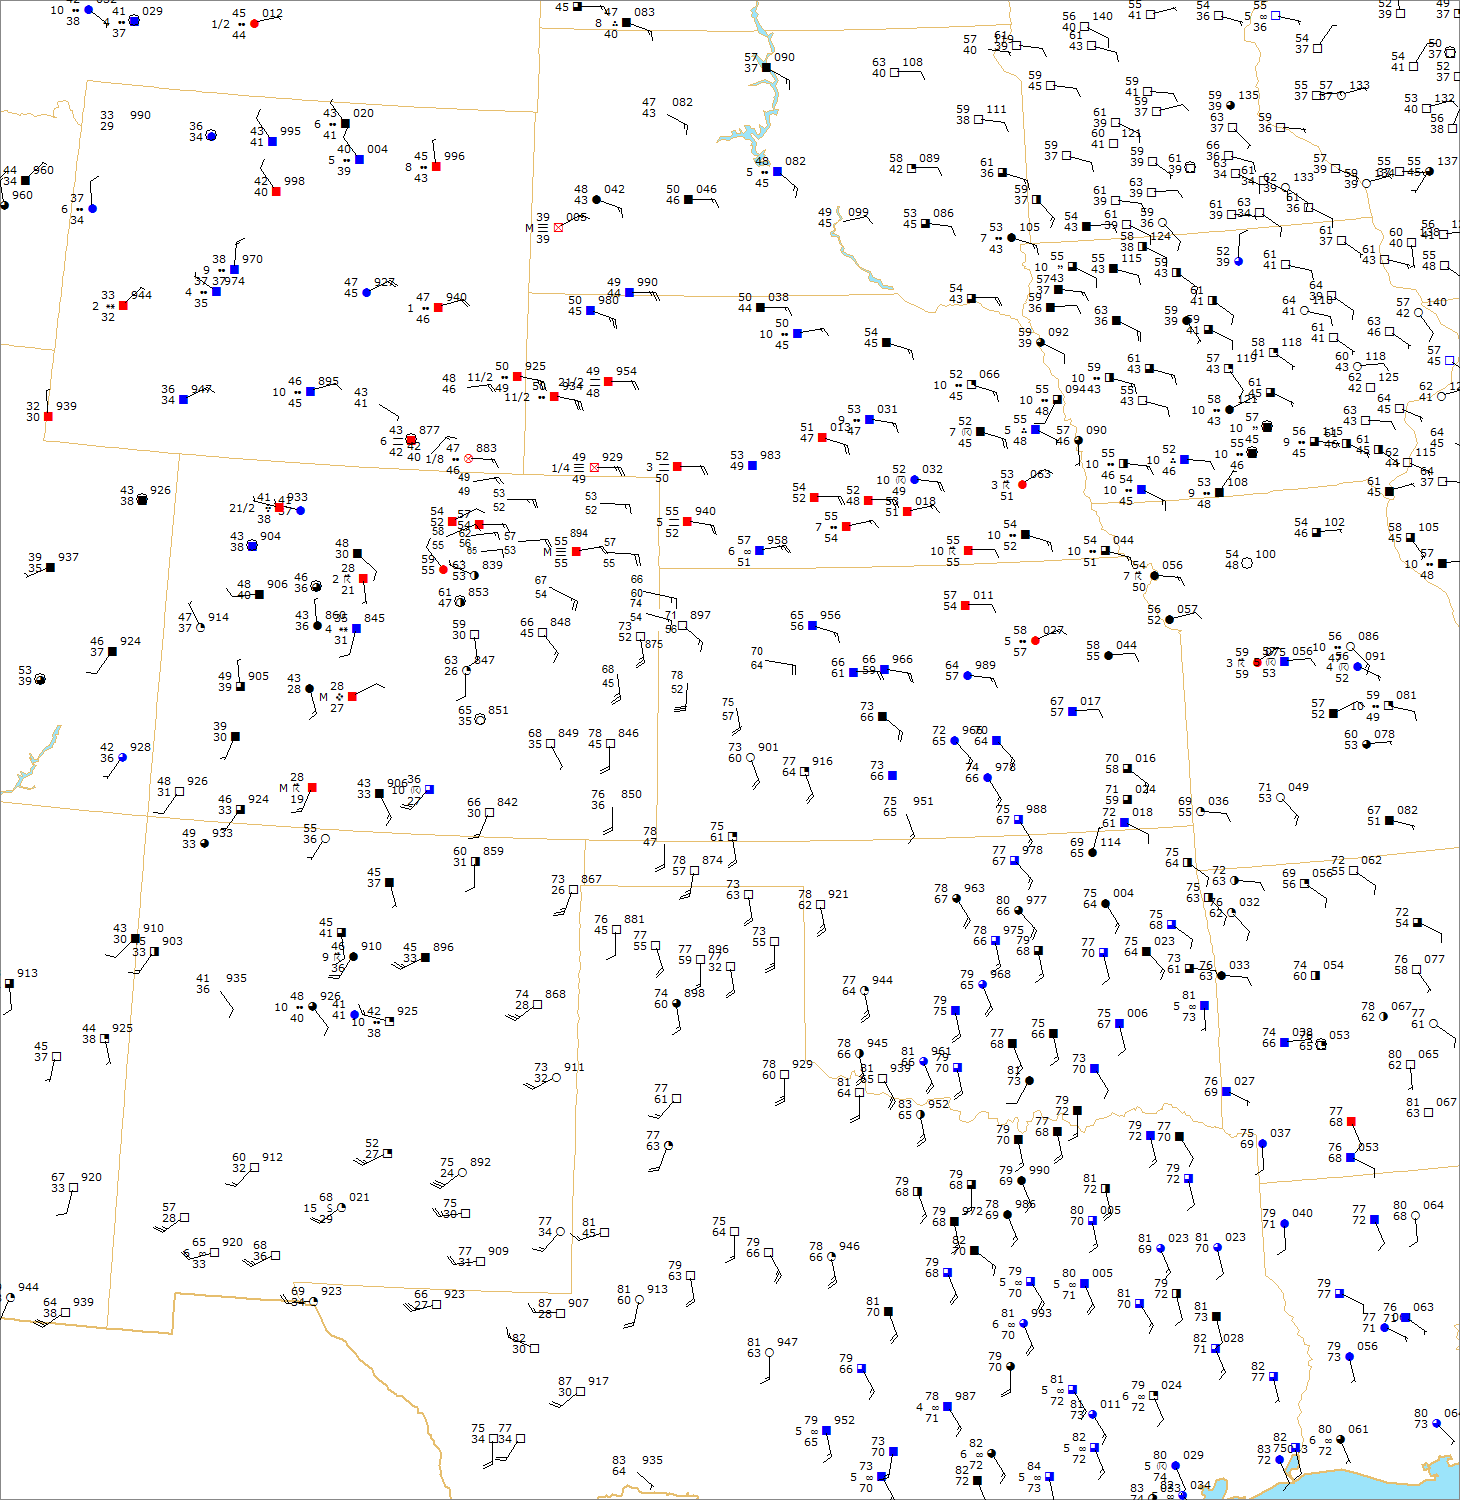
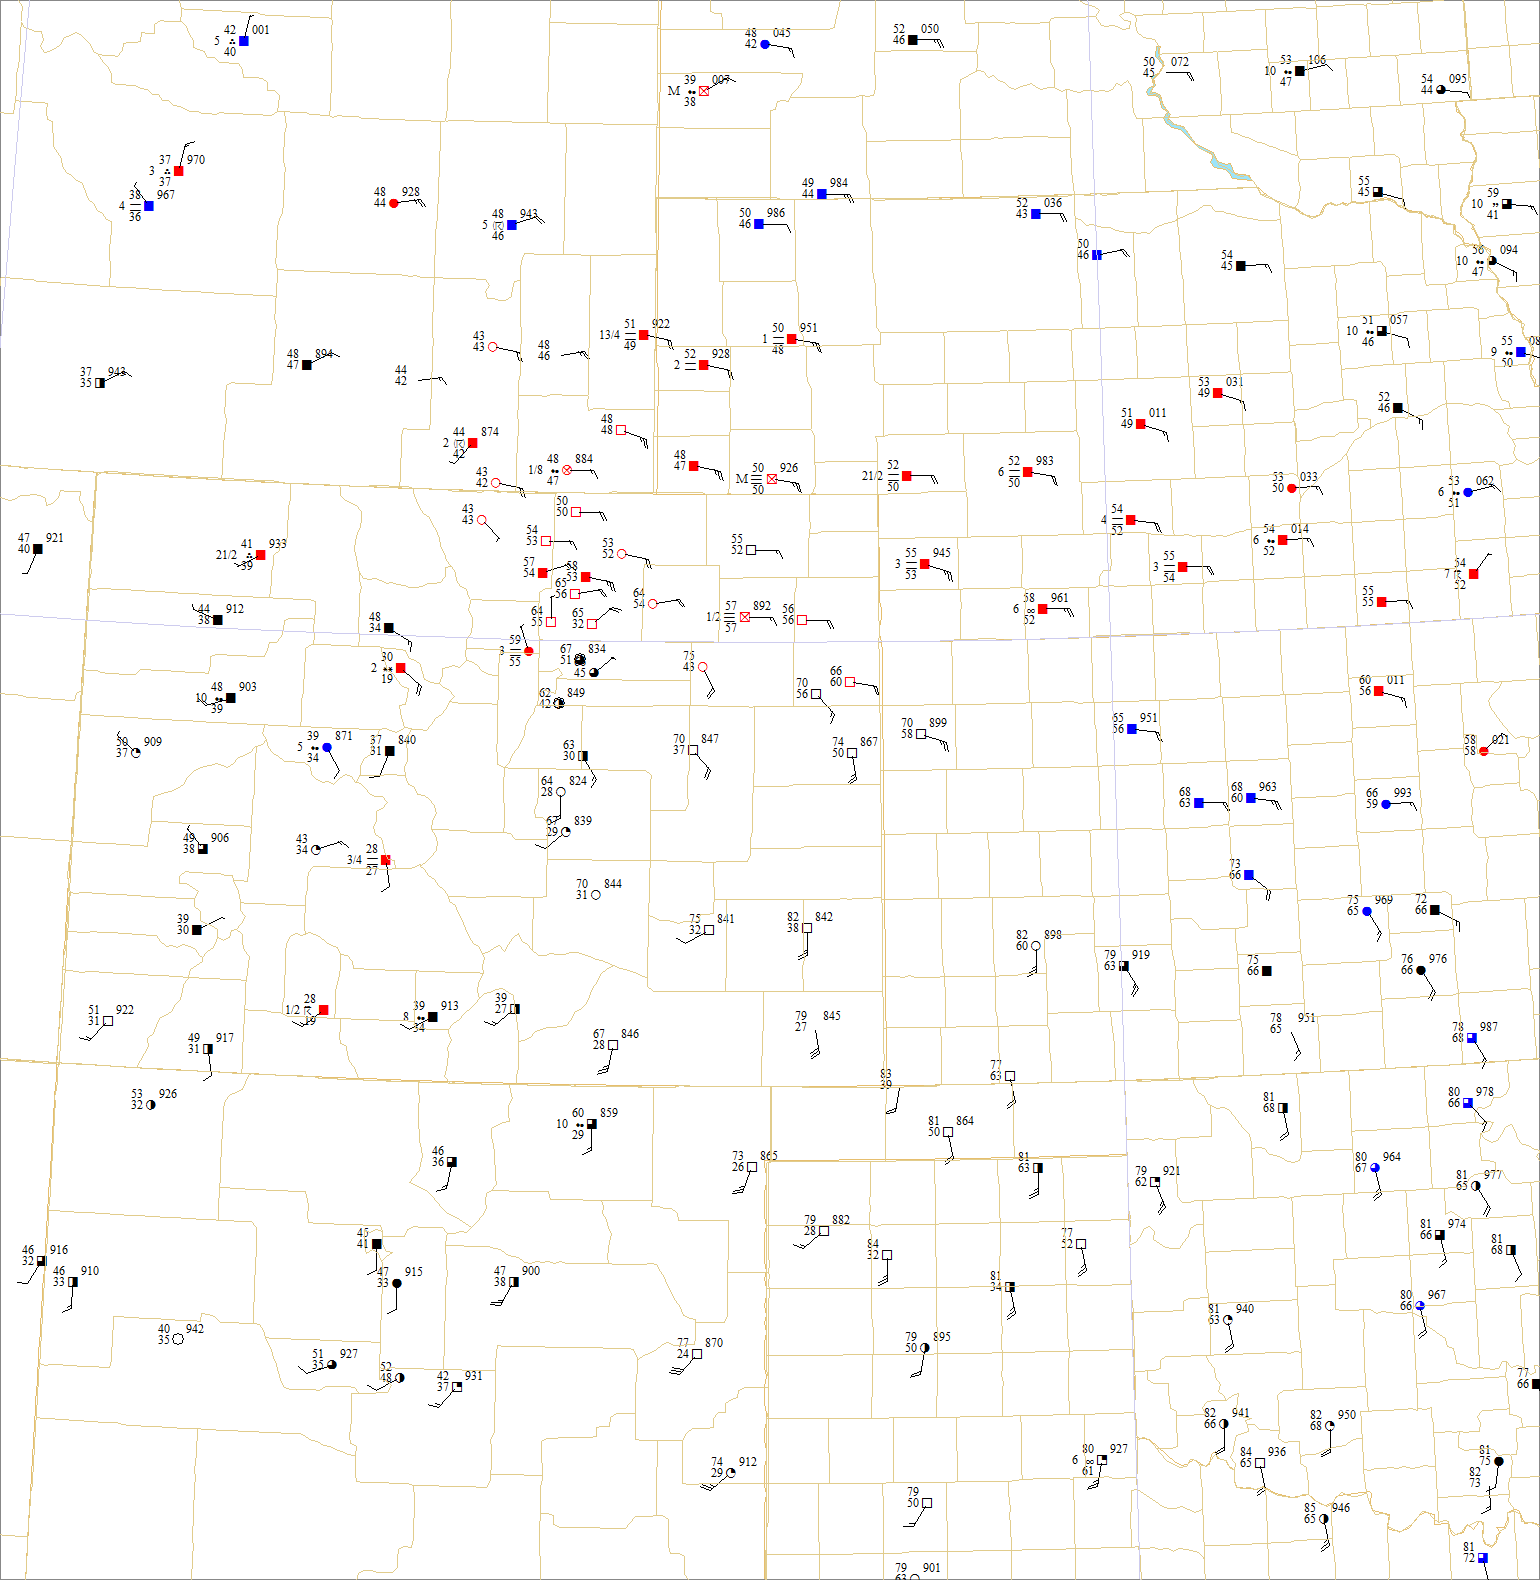
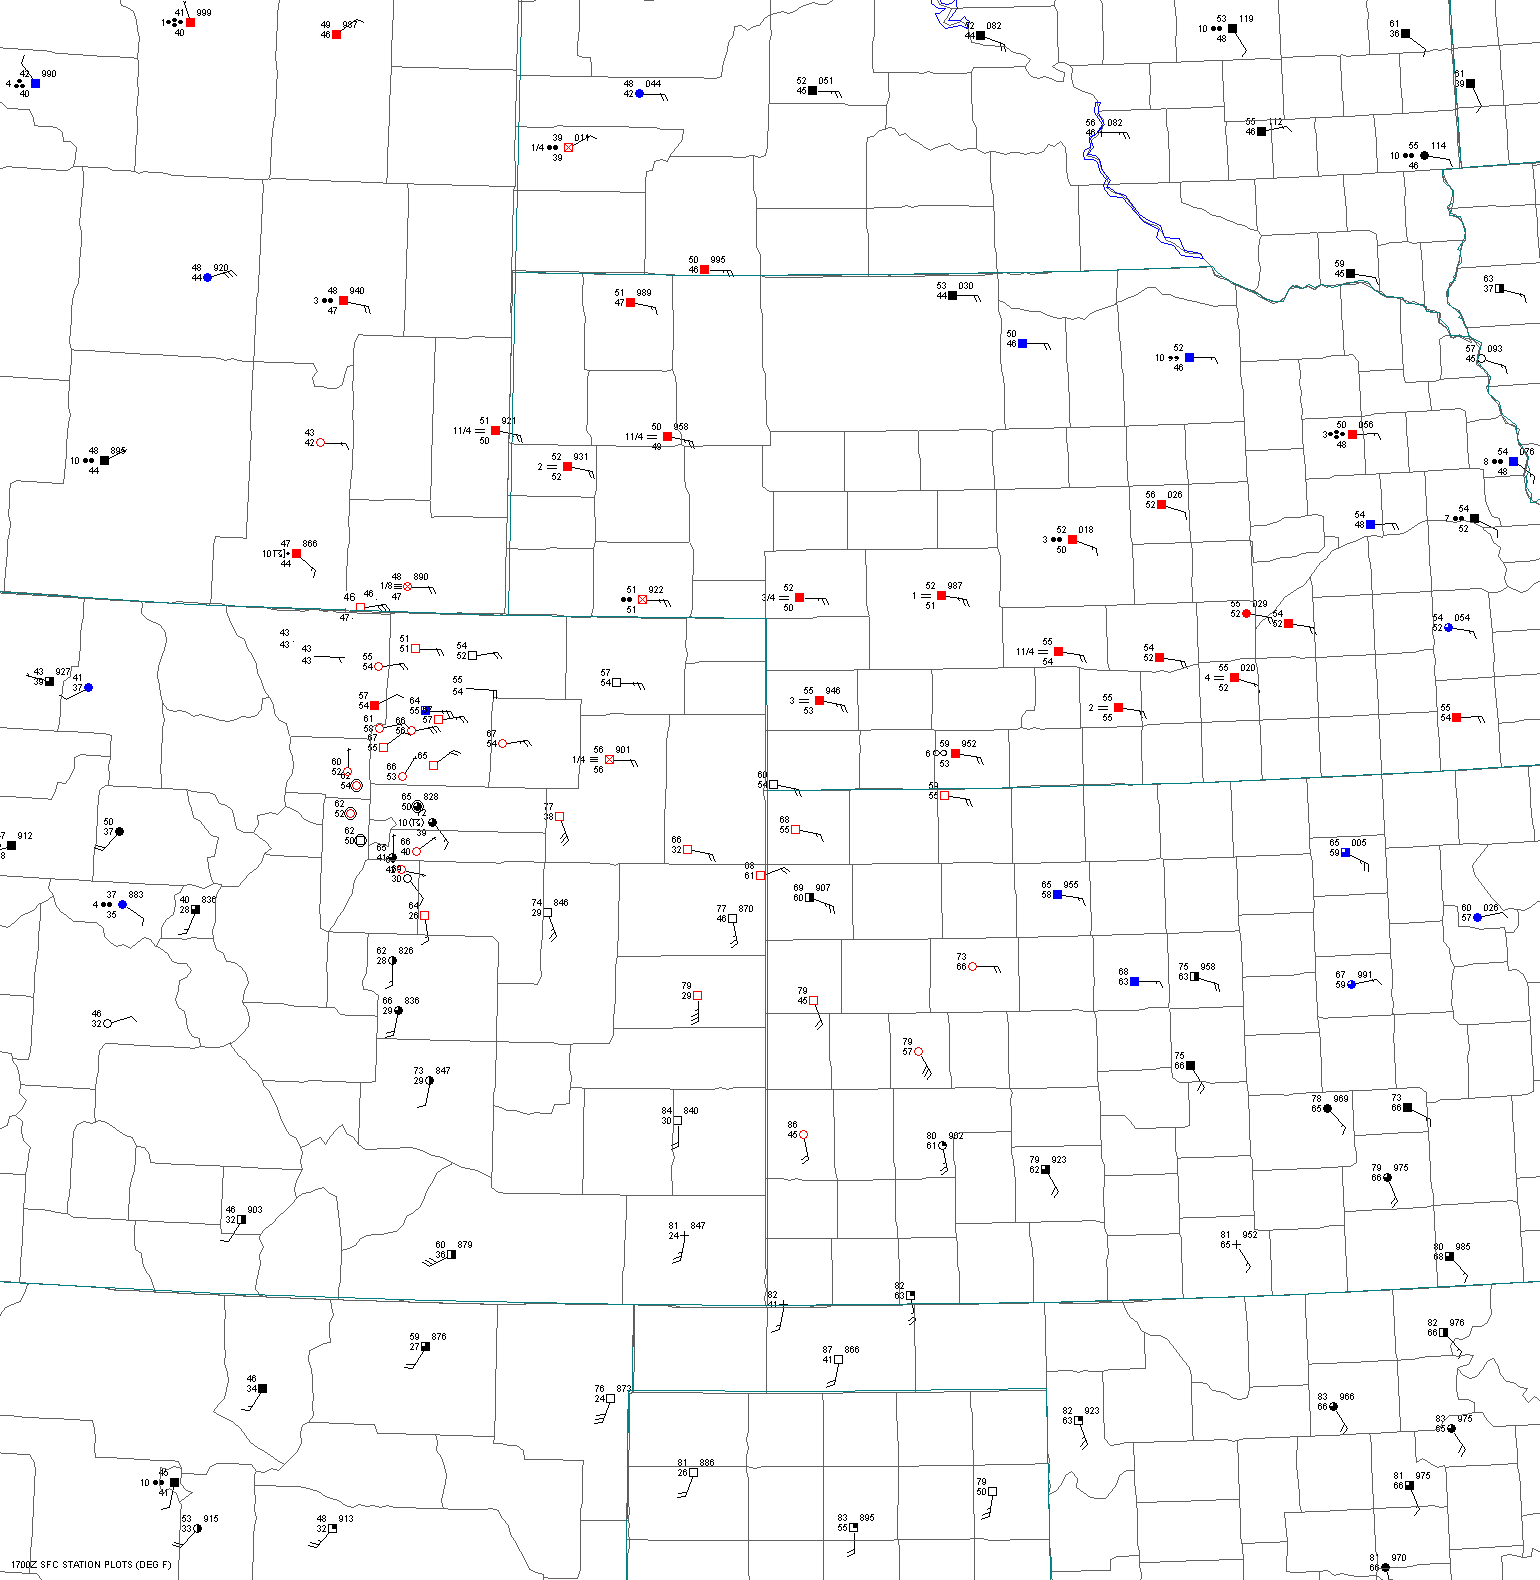
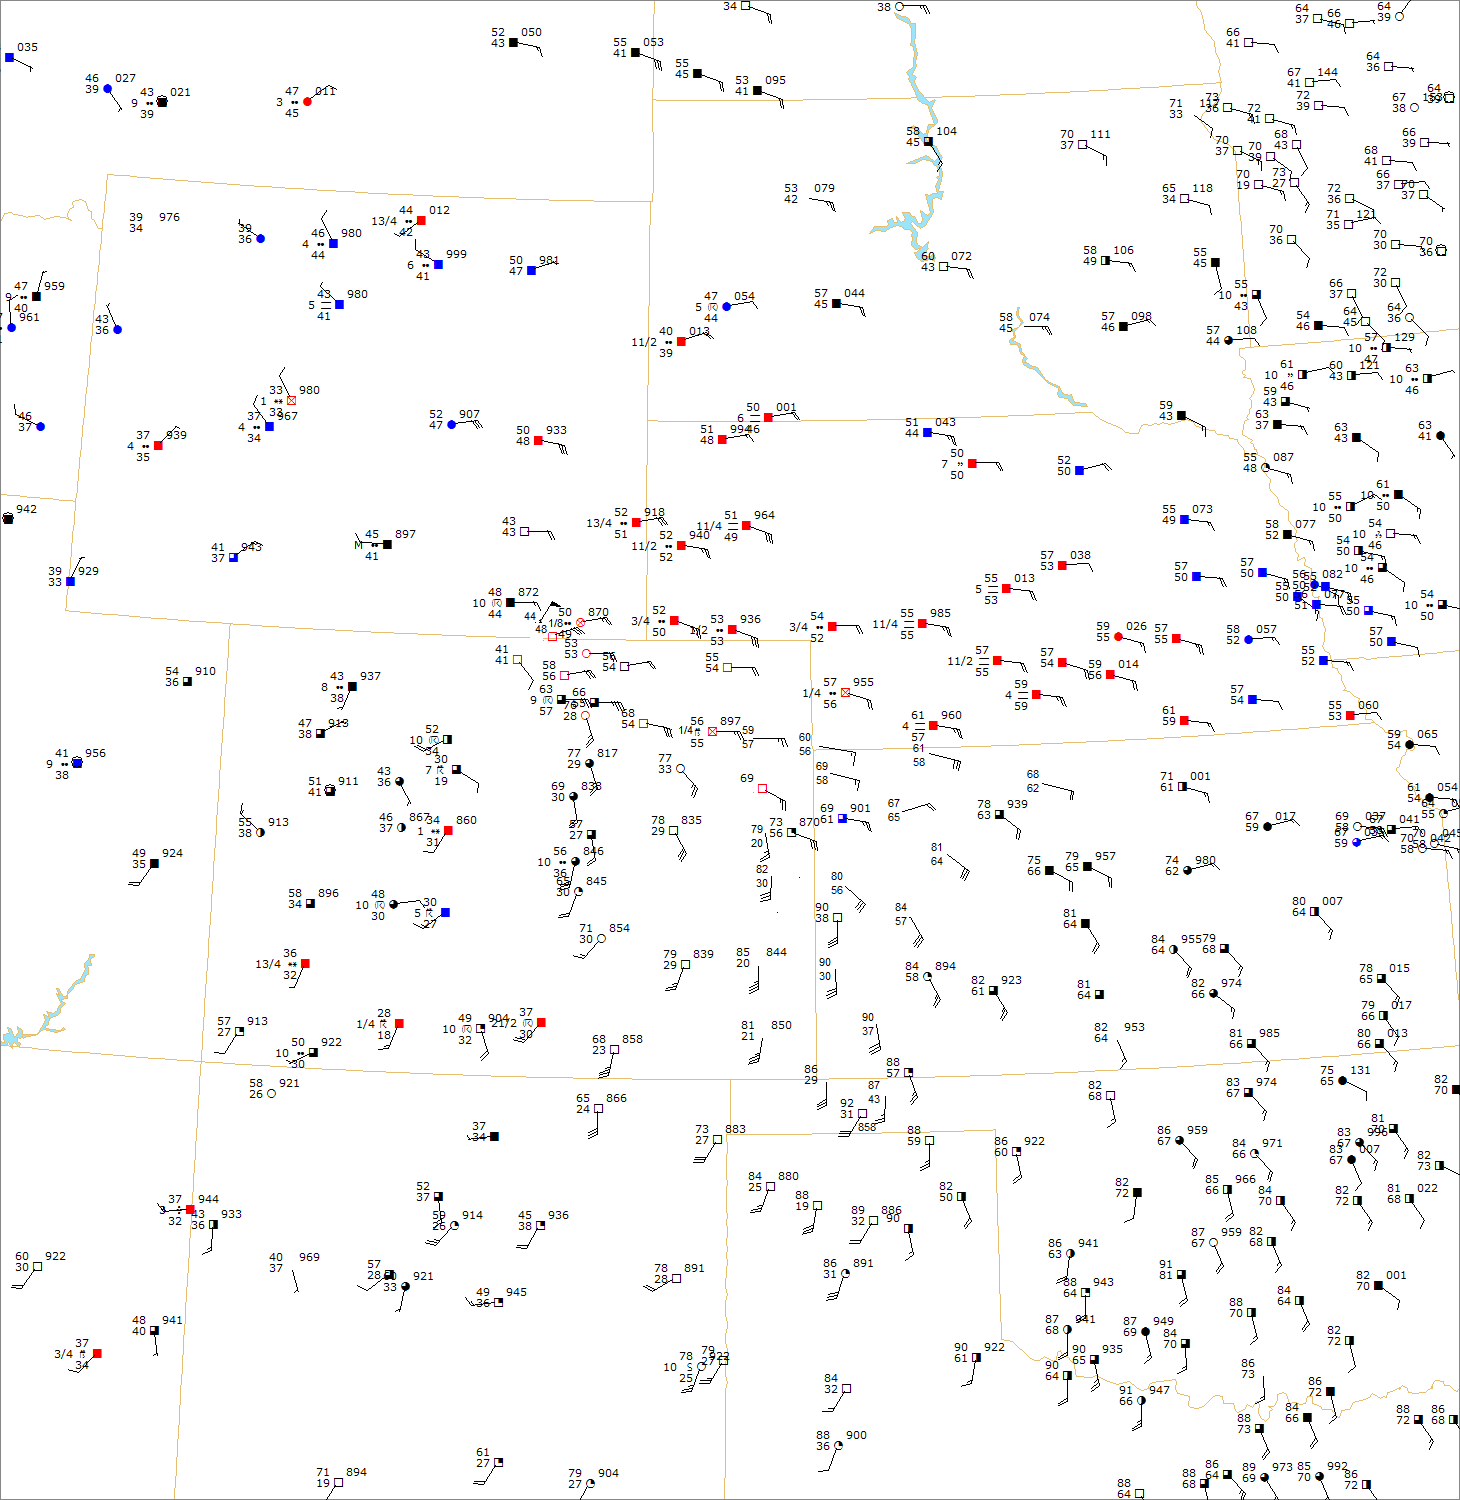
By
15UTC,
the warm front had progressed into central CO and western Kansas. Rich
moisture was in place across the front range of northern CO with 54 and
55F dewpoints at Greeley and Akron respectively. The surface theta-e
axis extended from central Kansas into northwest Kanas to Woodrow and
Greeley, CO. Strong upslope flow was occurring and rich moisture was
being transported into the Laramie Ridge and up the Laramie mountains.
A surface dryline was beginning to take shape from the western
Panhandles to extreme eastern Colorado.
By
16
UTC, 55-56F dewpoints were noted as far west as Kersey and
Boulder, CO, or just south and southwest of Greeley.
Convective clouds began to develop just south of the Denver
International Airport by 1620 UTC. This area of convection developed
into a thunderstorm by 1640 UTC just north of the airport.
The storm was severe by 1650 UTC just west of Hudson, CO. The
17
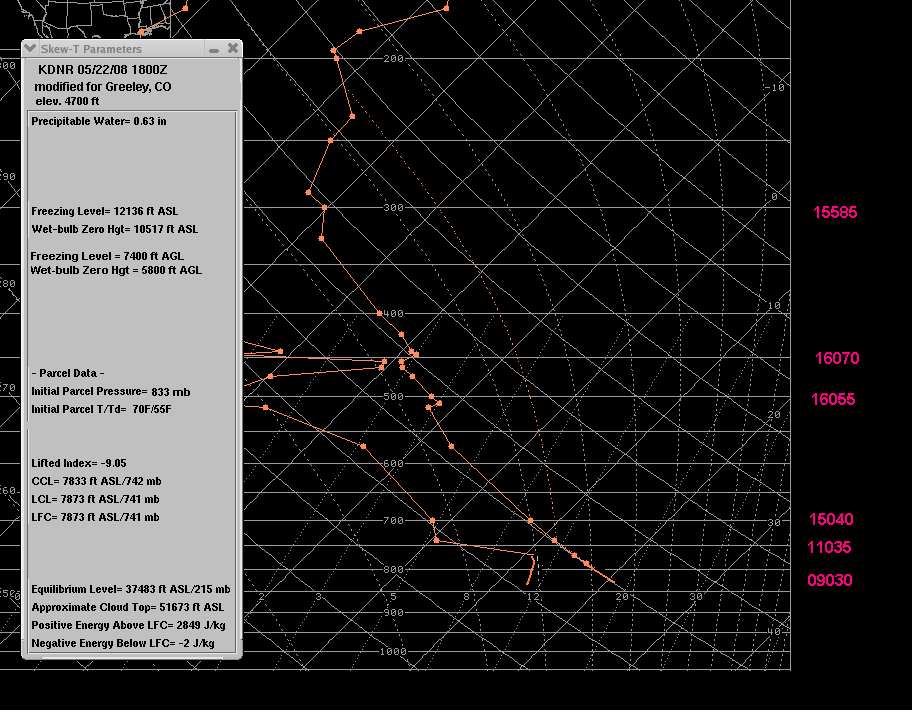
UTC surface chart showed a T/TD of 70F/55F at Greeley, CO.
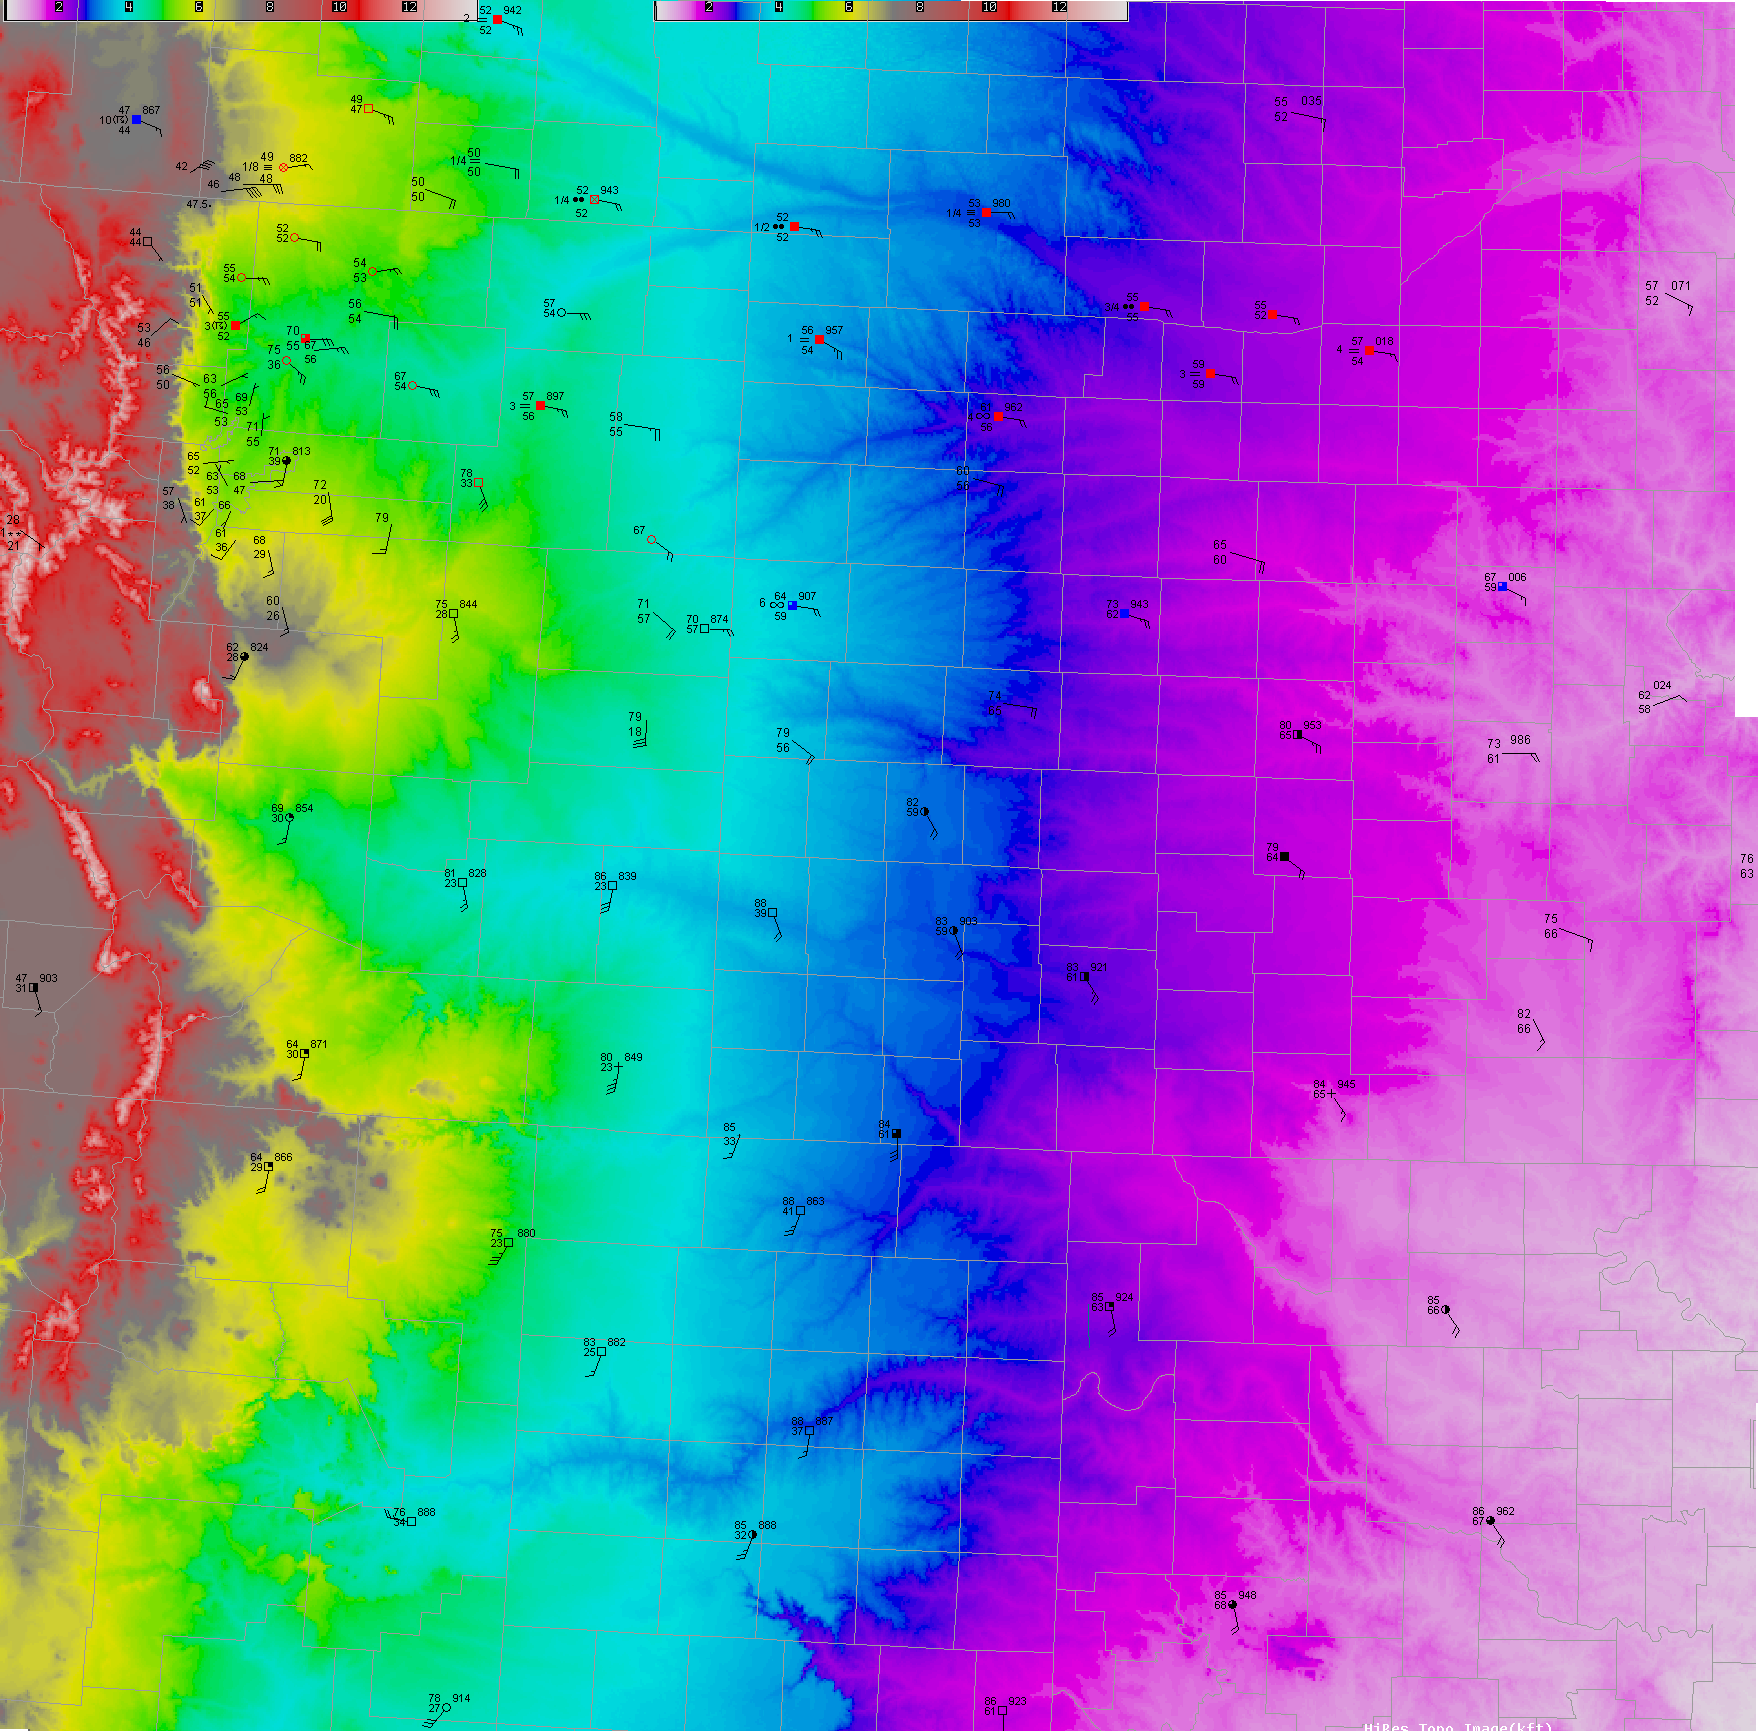
Modifying
the 18 UTC Denver sounding with these values yields 2800 j/kg surface
based CAPE. The moist axis extended all the way northwest to
Red Feather Lakes and Crystal Lake, where the T/TD were 43F/43F at both
stations. Interestingly, the theta-e values were the same at these
stations as Haigler, NE and Concordia, KS. T/TD values of 43F/43F at
Crystal Lake and 47F/47F at Harriman have almost the same theta-e as
T/TD values of 72F/61F at Emporia, KS and 74F/61F at Chanute,
KS.
Assuming saturation, what T/TD would be required at sea level to
achieve the same theta-e as Harriman, WY? Since the T/TD were
47F/47F at Harriman, a T/TD of 66F/66F would be required at 1000mb to
yield the same theta-e. Why is this? To understand this, let's look at
the potential temperature and mixing ratio's for both locations. For
Harriman, the potential temperature and mixing raio was 89F and 9.2
g/kg. At 1000mb, a location with T/TD of 66F/66F would have a potential
temperature of 66F and mixing ratio of 13.8 g/kg. Thus, the
mixing ratio would be 50% lower at Harriman than at the sea level
location. However, the potential temperature would be 23F higher at
Harriman. Thus the notion that it was too cool on the Laramie Ridge on
May 22, 2008 for severe storms is obviously misguided. In fact, it was
warm enough so that the level of free convection was near
the ground. This is despite dense fog and actual temperatures
from 44 to 48F. Thus before drawing conclusions about the severe
weather environment, one should modify soundings using actual surface
observations. Sometimes this requires the use of mesonet data since
surface observations are sparse.
Let's compare(Table 1)
the theta-e values on the elevated terrain and lower terrain by
displaying temperature, dewpoint, mixing ratio, potential temperature
and equivalent potential temperatures at 17 UTC. Note that only
temperature data were available for Harriman, Lynch, Virginia Dale 7
ENE and Emkay. Dewpoint data actually were available at the remainder
of the stations including Estes Park, Crystal Lakes and Red Feather
Lakes. However, since dense fog was present at these 4 Wyoming stations
through 19 UTC, we will assume that the dewpoints were equal to the
temperatures.
| Table 3 |
|
|
|
|
|
|
|
|
| 19 UTC |
Elev(ft) |
Pres.(mb) |
SLP(mb) |
T(F) |
Td(F) |
MR(g/kg) |
theta(F) |
theta-e(K) |
| Crystal
Lake |
8620 |
724 |
986 |
43 |
43 |
8.2 |
92 |
331.6 |
| Estes
Park |
7700 |
745 |
983 |
53 |
46 |
8.9 |
98 |
337.5 |
| Harriman,WY |
7450 |
756 |
987 |
47 |
47 |
9.2 |
89 |
332.5 |
| Lynch,WY |
7200 |
762 |
987 |
46 |
46 |
8.7 |
86.7 |
329.9 |
Virginia
Dale 7 ENE
|
7000 |
767 |
988 |
47 |
47 |
9 |
86.9 |
330.8 |
| Emkay,WY |
6720 |
774 |
989 |
49 |
49 |
9.6 |
87.6 |
333.1 |
| Cheyenne |
6140 |
789 |
987.7 |
48 |
47 |
8.8 |
83.5 |
328 |
Nunn
|
5650 |
804 |
986 |
51 |
51 |
10 |
83.8 |
331.8 |
| Wellington |
5300 |
813 |
985 |
55 |
54 |
11.1 |
86.3 |
336.5 |
| Briggsdale
S |
4838 |
833 |
991 |
55 |
54 |
10.8 |
82.6 |
333.3 |
| Greeley |
4700 |
835 |
984 |
64 |
55 |
11.2 |
91.7 |
340.2 |
| Akron |
4700 |
841 |
990 |
56 |
56 |
11.5 |
82.1 |
335.1 |
| Goodland |
3700 |
870 |
990.7 |
69 |
60 |
12.9 |
90.4 |
344.5 |
| Saint
Francis |
3350 |
881 |
|
68 |
55 |
10.6 |
87.4 |
335.8 |
| Hill City |
2600 |
918 |
995.5 |
65 |
58 |
11.3 |
78 |
332 |
| Concordia |
1500 |
948 |
1000.5 |
65 |
59 |
11.4 |
73.1 |
329
|
| OKC |
1230 |
951 |
997 |
81 |
66 |
14.6 |
88.8 |
348.5 |
| Chanute |
1000 |
967 |
1001.6 |
74 |
61 |
12 |
79.1 |
334.6 |
| Salina |
1280 |
957 |
999.1 |
67 |
59 |
11.3 |
73.6 |
329 |
| Emporia |
1170 |
960 |
1001.5 |
72 |
61 |
12.1 |
78.2 |
334.3 |
Notice that Lynch, WY actually has the same theta-e as Salina,
KS
even though the temperature/dewpoint are 21F/13F higher at Salina. The
mixing ratio is 30% higher at Salina, so the potential temperature must
compensate to yield similar theta-e values. Indeed, the potential
temperature was 86.7F at Lynch and only 73.6F at Salina.
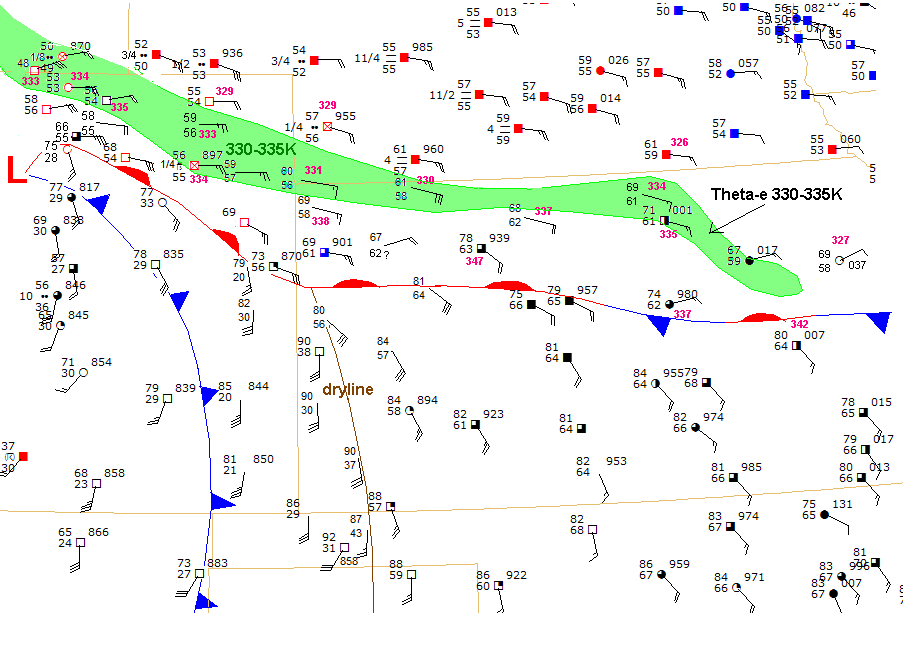
Surface theta-e
continued to increase from 17 to
18
to
19
UTC.
Tables 2 and 3 show
temperature, dewpoint, mixing ratio, potential temperature and
equivalent potential temperature values for various sites over the
plains. Again, this is done to demonstrate that T/Td values
cannot be used without elevation to assess how "juiced up" the surface
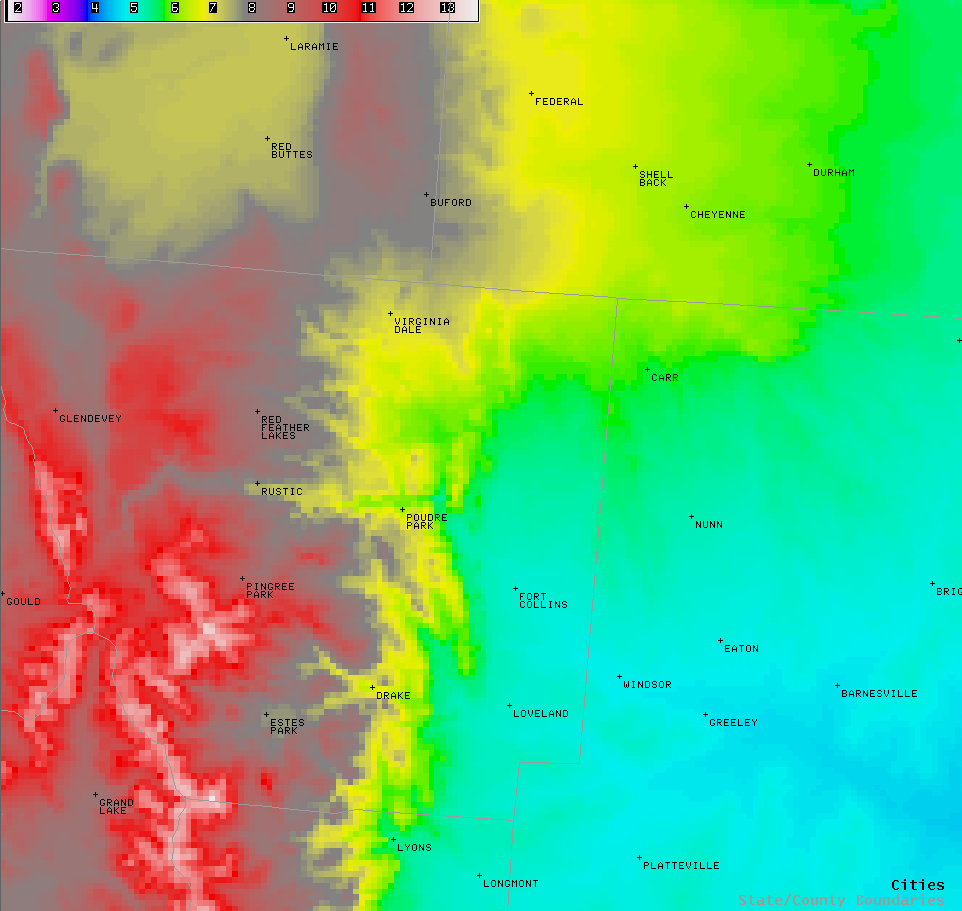
layer is. In Table 5 the theta-e values between 330K and 335K
are highlighted in red. The
theta-e
values from 330 to 335K are shown in a partially analyzed surface chart
for 19 UTC.
Let's compare(Table 2) the
theta-e values on the elevated terrain and lower terrain by displaying
temperature, dewpoint, mixing ratio, potential temperature and
equivalent potential temperatures at 18 UTC.
| Table 2 |
|
|
|
|
|
|
|
|
| 18 UTC |
Elev(ft) |
Pres.(mb) |
SLP(mb) |
T(F) |
Td(F) |
MR(g/kg) |
theta(F) |
theta-e(K) |
| Crystal
Lakes |
8620 |
723 |
|
43 |
43 |
8.2 |
91.7 |
331.4 |
| Red
Feather |
8214 |
733 |
|
44 |
44 |
8.4 |
90.7 |
331.4 |
| Harriman,WY |
7450 |
755 |
987 |
47 |
47 |
9.2 |
89.3 |
332.7 |
| Lynch,WY |
7200 |
761 |
987 |
46 |
46 |
8.8 |
87 |
330.1 |
Virginia
Dale 7 ENE
|
7000 |
766 |
987 |
48 |
48 |
9.4 |
88.1 |
332.7 |
| Emkay,WY |
6720 |
773 |
987 |
48 |
48 |
9.3 |
86.7 |
331.5 |
| Cheyenne |
6140 |
788 |
988.2 |
49 |
49 |
9.5 |
84.8 |
330.8 |
Nunn
|
5650 |
803 |
985 |
52 |
52 |
10.4 |
85.1 |
333.7 |
| Greeley |
4700 |
833 |
983 |
70 |
55 |
11.2 |
98.4 |
344.5 |
| Akron |
4700 |
840 |
989.7 |
57 |
56 |
11.5 |
83.4 |
335.9 |
| Goodland |
3700 |
870 |
990.7 |
64 |
59 |
12.4 |
85.2 |
339.7 |
| MCcook |
2800 |
911 |
996.2 |
61 |
56 |
10.6 |
75 |
328 |
| Hill City |
2600 |
918 |
994.3 |
73 |
62 |
13.1 |
86.2 |
342.4 |
| Concordia |
1500 |
948 |
1000.6 |
67 |
59 |
11.4 |
75.1 |
330.3 |
| Imperial |
3300 |
885 |
995.7 |
56 |
54 |
10.2 |
74.3 |
326.3 |
| OKC |
1230 |
951 |
996.2 |
86 |
67 |
15.1 |
93.9 |
353.4 |
| Chanute |
1000 |
967 |
1001.6 |
76 |
64 |
13.4 |
81.2 |
339.9 |
| Topeka |
890
|
972 |
1004.1 |
66 |
59 |
11.1 |
70.3 |
326.4 |
| Salina |
1280 |
957 |
998.6 |
73 |
61 |
12.1 |
79.7 |
335.4 |
| Emporia |
1170 |
960 |
1001.4 |
76 |
63 |
13.0 |
82.3 |
339.5 |
Notice that Greeley, CO
actually has a higher theta-e than Emporia, KS even
though the temperature/dewpoint are 6F/8F higher at Emporia. The
mixing ratio is 16% higher at Emporia, so the potential temperature
must have
compensated to yield a higher theta-e at Greeley. Indeed, the potential
temperature was 98.4F at Greeley and only 82.3F at Emporia.
Notice that Red Feather Lakes, CO actually has a higher theta-e than
Concordia, KS even
though the temperature/dewpoint are 23F/15F higher at Concordia. The
mixing ratio is 36% higher at Concordia, so the potential temperature
must compensate to yield a higher theta-e at Red Feather
Lakes.
Indeed, the potential
temperature was 90.7F at Red Feather Lakes and only 75.1F at Concordia.
Severe storms passed just east of Red Feather Lakes in the early
afternoon.
Let's compare(Table 3) the
theta-e values on the elevated terrain and lower terrain by displaying
temperature, dewpoint, mixing ratio, potential temperature and
equivalent potential temperatures at 19 UTC.
| Table 3 |
|
|
|
|
|
|
|
|
| 19 UTC |
Elev(ft) |
Pres.(mb) |
SLP(mb) |
T(F) |
Td(F) |
MR(g/kg) |
theta(F) |
theta-e(K) |
| Harriman,WY |
7450 |
754 |
985 |
47 |
47 |
9.3 |
89.7 |
333.3 |
| Lynch,WY |
7200 |
760 |
985 |
48 |
48 |
9.5 |
89.4 |
333.6 |
Virginia
Dale 7 ENE
|
7000 |
765 |
985 |
48.5 |
48.5 |
9.6 |
88.9 |
333.7 |
| Emkay,WY |
6720 |
772 |
986 |
49 |
49 |
9.7 |
88.2 |
333.8 |
| Cheyenne |
6140 |
787 |
987.7 |
50 |
49 |
9.5 |
86 |
331.7 |
Nunn
|
5650 |
803 |
983 |
52.5 |
52.5 |
10.6 |
85.6 |
334.6 |
| Wellington |
5300 |
812 |
983 |
58 |
56 |
11.9 |
87.9 |
341.1 |
| Briggsdale
N |
5039 |
826 |
988 |
56 |
54 |
10.0 |
84.9 |
335.1 |
| Iliff |
3900 |
865 |
988 |
55 |
54 |
10.4 |
76.8 |
328.5 |
| Sterling |
3900 |
865 |
|
59 |
56 |
11.2 |
80.9 |
333.4 |
| Briggsdale
S |
4838 |
831 |
988 |
58 |
55 |
11.2 |
86.1 |
336.8 |
| Akron |
4700 |
840 |
990 |
56 |
55 |
11.1 |
82.3 |
334.1 |
| Goodland |
3700 |
870 |
990 |
69 |
61 |
13.4 |
90.4 |
345.8 |
| Haigler |
3291 |
883 |
|
60 |
56 |
11 |
78.8 |
331.4 |
| OBerlin |
2736 |
911 |
|
61 |
58 |
11.4 |
75 |
330.4 |
| Saint
Francis |
3350 |
881 |
|
68 |
57 |
11.4 |
87.4 |
338.1 |
| Hill City |
2600 |
918 |
994 |
78 |
63 |
13.6 |
91.3 |
347.2 |
| Concordia |
1500 |
948 |
1000 |
71 |
61 |
12.2 |
79.2 |
335.3 |
| OKC |
1230 |
951 |
996 |
87 |
67 |
15.1 |
94.9 |
354.1 |
| Chanute |
1000 |
967 |
1001.5 |
78 |
65 |
13.8 |
83.2 |
342.3 |
| Topeka |
890
|
972 |
1003.7 |
69 |
58 |
10.7 |
73.3 |
327.2 |
| Salina |
1280 |
957 |
998.0 |
74 |
62 |
12.6 |
80.7 |
337.3 |
| Fairbury |
1500 |
950 |
1003.0 |
61 |
59 |
11.4 |
68.9 |
326.1 |
| Scandia |
1450 |
949 |
1001 |
69 |
61 |
12.2 |
77 |
333.9 |
Notice that Harriman, WY
actually has almost the same theta-e as Scandia, KS, even
though the temperature/dewpoint are 22F/14F higher at Scandia. The
mixing ratio is 31% higher at Scandia, so the potential temperature
must
compensate to yield similar theta-e values. Indeed, the potential
temperature was 89.7F at Harriman and only 77F at Scandia.
At 19 UTC, two mesonet
observations and 1 cooperative observer location recorded hourly
temperatures. The temperature was 47F at Harriman (756mb), 48.5F at the
cooperative observer site 7 miles east-northeast of
Virginia Dale (767mb) and 48F at Lynch (762mb). These 3
observations lie along the same moist adiabat, as one would
expect in moist upslope flow. So I have fairly high confidence
in the accuracy of these measurements. Veta Mitchell, the cooperative
observer 7 miles east-northeast of Virginia Dale provided me with the
hourly temperature measurements for her location. The tornado
actually first touched down about 2 miles north-northwest of her house.
So the hourly measurements that she collected are very useful
in determining surface based CAPE.
An important thing to note is that a 47F dewpoint at Harriman actually
has about the same mixing ratio as a 54.5F dewpoint at 1000mb. Of
course this assumes that the sea level pressure at Virginia Dale and
1000mb are similar. If the sea level pressure is higher at the lower
elevation then the difference would be greater. Also, even
though 47F seems chilly, this temperature at 7500ft
actually lies along the same dry adiabat as 90F at 1000mb.
Since visibilities were
near zero before the storm, I am assuming that dewpoints were
equal to the temperatures. I constructed approximate soundings for
these locations using the 18 UTC RUC initialization and 18 UTC
Denver sounding. Of course, the boundary layer had to be modified based
on the surface observations. I modified using the 19 UTC observations
since these are just prior to the tornadic storm. The
RUC soundings were more representative than the
NAM/WRF soundings. The nam soundings were superadiabatic near
the surface and dry adiabatic above
the surface layer. This is not reasonable. The RUC soundings
were closer to moist adiabatic from the surface to
above 700mb. The modified 18 UTC RUC soundings yielded similar
CAPE values to the modified 18 UTC Denver sounding. I have determined
that the surface based CAPE was 1000-1300 j/kg near
the beginning of the Harriman-Laramie tornado path
where surface measurements were available. The theta-e values
at the three locations were almost identical.
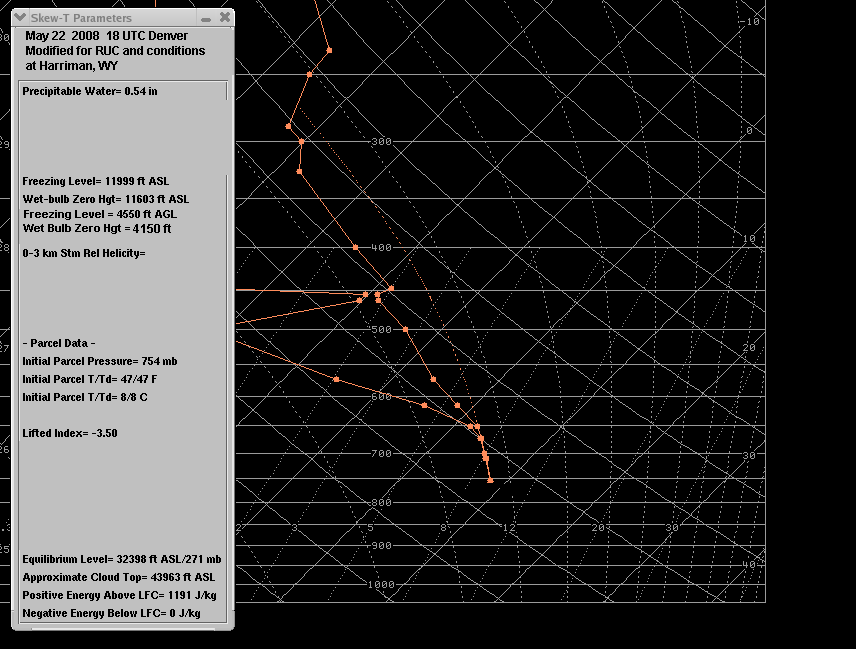
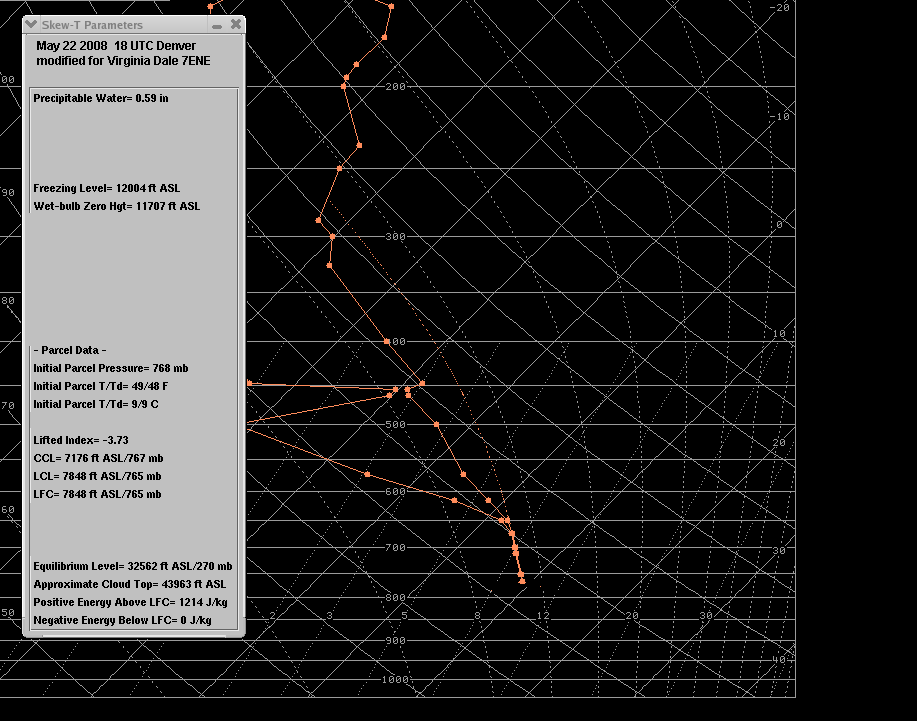
Table 4 and Table 5 show
the surface based CAPE values for Harriman, Virginia Dale and Lynch.
Table 1 uses the 18 UTC Denver sounding while Table 2 uses the 18 UTC
RUC initialization. These are modified using the temperature readings
from the 3 stations and assumes saturation (there was dense
fog).
Table 4
|
|
|
|
|
|
|
|
|
| DEN 18 UTC modified |
Elev(ft) |
Pres.(mb) |
T(F) |
Td(F) |
MR(g/kg) |
theta(F) |
theta-e(K) |
CAPE(j/kg) |
| Harriman |
7450 |
756 |
47 |
47 |
9.2 |
89 |
332.5 |
1190 |
| Virginia Dale(7ene) |
7000 |
760 |
48.5 |
48.5 |
9.6 |
88.9 |
333.7 |
1217 |
| Lynch |
7200 |
766 |
48 |
48 |
9.5 |
89.4 |
333.6 |
1215 |
Table 5
|
|
|
|
|
|
|
|
|
| RUC 18 UTC modified |
Elev(ft) |
Pres.(mb) |
T(F) |
Td(F) |
MR(g/kg) |
theta(F) |
theta-e(K) |
CAPE(j/kg) |
| Harriman |
7450 |
756 |
47 |
47 |
9.2 |
89 |
332.5 |
1260 |
The vertical wind shear
profile featured strong shear. The surface wind backed to the northeast
by midday at the mesonet locations. However, windspeed is not
represented the same way at the mesonet locations. For some hours the
wind speed was the same as the wind gust while for other hours they
were vastly different. Also, some of the winds measurements were
influenced by inflow into the storm. The pre-storm winds were probably
about 25 kts from the east-northeast or northeast(060 deg at 25kts).
Wylie Walno reported that the winds was about 20-30 kts. For the winds
above the surface we used the Medicine Bow and Platteville
profilers as well as the 18 UTC RUC. The wind just above the moist
layer (600mb) was about 140 deg at 55kts. So there was
tremendous shear between the surface and 600mb (1.5 to 1.8 km agl). The
500mb wind was from 150 deg at 55 kts while the 400mb wind was from 165
deg at 75 kts. 400mb is 4.4 to 4.7 km above the surface, so the shear
from the surface to 4.5 km was about 80 kts.
It is very difficult to
achieve low dewpoint depressions, relatively high theta-e values at
low-levels and excellent vertical wind shear at 7500-8500ft on
the Laramie Ridge/Mountains. As previously mentioned, the dewpoints
were equal to the temperatures along and east of the summit of the
Laramie Ridge. But surface based CAPE values still exceeded 1000 j/kg.
In typical low plains severe storm situations, 1000 j/kg CAPE would be
considered very marginal. When CAPE is marginal, tornadic storms can
still occur, especially when LCL and LFC heights are low and
considerable surface based CAPE exists at low levels. This was indeed
the case on May 22 on the Laramie Ridge. In fact, after initially
weakening upon moving into cooler air on higher terrain northwest of
Wellington, CO, the storm quickly reintensified after encountering
dense fog east of Virginia Dale.
One would think that it
would be easier to get sufficient CAPE and shear on the high
terrain(7000+ ft) in June or July than in April or May. But
this is not necessarily the case. Strong synoptic scale systems in
spring can have very strong upslope flow associated with them, whereas
systems in late spring and summer tend to be weaker, with weaker
upslope flow. That said, the upslope flow tends to be cooler in April
and May and oftentimes more stable. Upslope flow tends to be located on
the cool side of a surface front or north of a developing surface low.
Again, these airmasses tend to be too cool in April and much of May.
This is why significant tornadoes are so rare in the immediate lee of
the Laramie Mountains. The upslope flow in the May 22 case was
"cooler", but 1000+ j/kg surface based CAPE values were still achieved.
Elevations from 5000-6000 ft do have more severe weather in June and
July compared to April and May. But further west on the very
high terrain, strong upslope flow is generally required to obtain
adequate theta-e values, low dewpoint depressions and high
shear that typically accompany tornadic storms. By mid-June,
strong upper systems become less common so that very strong upslope
flow is rare. In the May 22 case, gulf moisture raced northwestward
from north Texas and southern Oklahoma into northern Colorado and
southeast Wyoming in 9 to 12 hours from 00 to 09 UTC. Then during the
day of May 22, a very strong upslope flow developed north of a surface
front. Very strong upslope flow is required to keep adequate mixing
ratios at the 7000-8000 ft elevations on the eastern slopes of the
Laramie mountains. It is also important to understand that it is the
potential temperature that is important in achieving higher theta-e
values and not the temperature.Even in the presence of only moderately
cool 500-300mb temperatures of -13C, -26C and -40C, surface
temperatures from 7 to 9C were still sufficient to yield moderately
high theta-e values, and hence moderately high CAPE values. When
potential temperatures are high, mixing ratios do not have to be very
high to achieve sufficiently high theta-e values. By later in June and
July, surface temperatures become so warm that cloud bases are
typically too high for tornadic storms given the meager mixing ratios
typically found at these elevations.
Additional surface charts will be coming soon. Since terrain is so
crucial to this meteorological discussion, I like to plot the surface
observations on top of the terrain. However, this is a very
labor-intensive process, especially since I need to include the mesonet
observations.
Hodographs will be constructed soon.