Potential Temperature and Mixing Ratio--Contributions
to Theta-e
on Elevated Terrain
Jonathan D. Finch
Links
Main
Page
Elevated
Mixed Layer
Convective
Outlooks
Special
Cases for the United States
Bengal
Tornadoes--background information
Meteorological
Charts for Historical Tornado Cases for Bengal
Latitudinal
Comparison of the Geostrophic Wind Approximation
Assessing
Instability on the Front Range Without Upper Air Data
High plains and front range topo maps
As experienced storm chasers
are well aware, severe thunderstorms occur on the high plains with much
lower surface dewpoint
temperatures than at low
elevations. For example, supercell thunderstorms occur in spring and summer
with dewpoints only from
3 to 15C(37 to 59F). Exactly
why can we get by with lower dewpoints and still get explosive storms?
The answer is twofold. In
answering this question
I would like to correct a common misunderstanding concerning dewpoint temperature.
I have often heard
something like, "wow Cheyenne
has a 60F dewpoint, thats like a 80 dewpoint at our elevation". This is
incorrect. The dewpoint
lapse rate is only about
1F /1000ft. This means that a 50F dewpoint at CYS has the same moisture
as roughly a 56F dewpoint
at Houston. This corresponds
to a mixing ratio of 9.6g/kg. In June, if the dewpoint at Houston
is 56F, then the CAPE is
probably close to zero for
any reasonable 500mb temperature. But at Cheyenne, if the wind is from
the east or southeast and the
dewpoint is 50F(same
amount of moisture), then interesting things can happen. Obviously
it is not the high moisture content that
is responsible for a threat
for storms at Cheyenne. To explain the importance of potential temperature
we will consider the following
comparison between several
stations.
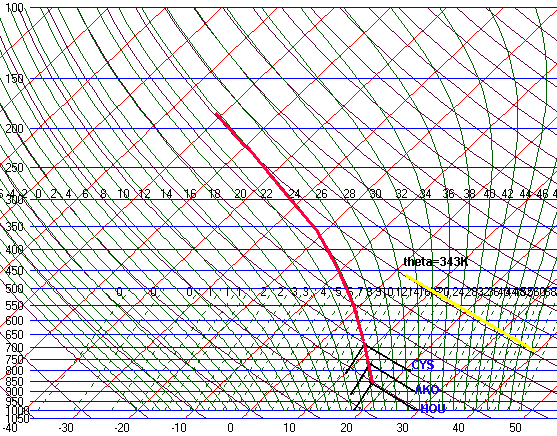
Constraints: Mixing ratio, Potential Temperature and Theta-E
are forced to be constant and SLP = 1000mb
| Elev(ft) | Pressure(mb) | T(F) | Td(F) | MR(g/kg) | Theta(F) | Theta-e(K) | |
| Laramie | 7280 | 769 | 63.4 | 48.7 | 9.6 | 104 | 343.2 |
| Cheyenne | 6140 | 806 | 70.1 | 49.9 | 9.6 | 104 | 343.2 |
| Limon | 5360 | 823 | 73.4 | 50.6 | 9.6 | 104 | 343.2 |
| Akron | 4700 | 845 | 77.4 | 51.3 | 9.6 | 104 | 343.2 |
| Dalhart | 4000 | 869 | 82 | 52 | 9.6 | 104 | 343.2 |
| Goodland | 3700 | 878 | 83.4 | 52.3 | 9.6 | 104 | 343.2 |
| Dodge City | 2600 | 915 | 89.8 | 53.4 | 9.6 | 104 | 343.2 |
| Wichita | 1340 | 954 | 96.3 | 54.6 | 9.6 | 104 | 343.2 |
| Coffeyville | 750 | 975 | 99.9 | 55.2 | 9.6 | 104 | 343.2 |
| Houston(HOU) | 50 | 998 | 103.6 | 55.8 | 9.6 | 104 | 343.2 |
In the above example, if
the MR(mixing ratio) is forced to be equal at differing elevations, then
a much higher surface temperature
is required at the lower
elevation to achieve the same surface theta-e. Note that if the potential
temperature and mixing ratio are
both forced to be the same
at all elevations, then the theta-e will be the same at all elevations.
Thus, it is the POTENTIAL
TEMPERATURE that
is important in the generation of high theta-e and NOT strictly
the temperature(note the "cool" temperature
of 70F at Cheyenne.
Constraints: Dewpoint Depression and Theta-e are forced
to be constant and SLP = 1000mb
| Elev(ft) | Pressure(mb) | T(F) | Td(F) | MR(g/kg) | Theta(F) | Theta-e(K) | |
| Laramie | 7280 | 769 | 66.6 | 46.6 | 8.9 | 107.6 | 343.2 |
| Cheyenne | 6140 | 806 | 70.1 | 49.9 | 9.6 | 104 | 343.2 |
| Limon | 5360 | 823 | 71.6 | 51.6 | 10 | 102 | 343.2 |
| Akron | 4700 | 845 | 73.5 | 53.5 | 10.5 | 99.7 | 343.2 |
| Dalhart | 4000 | 869 | 75.6 | 55.6 | 11.0 | 97.3 | 343.2 |
| Goodland | 3700 | 878 | 76.3 | 56.3 | 11.15 | 96.6 | 343.2 |
| Dodge City | 2600 | 915 | 78.8 | 58.8 | 11.8 | 93.5 | 343.2 |
| Wichita | 1340 | 954 | 82.1 | 62.1 | 12.7 | 89.4 | 343.2 |
| Coffeyville | 750 | 975 | 83.6 | 63.6 | 13.1 | 87.5 | 343.2 |
| Houston(HOU) | 50 | 998 | 85.2 | 65.2 | 13.5 | 85.5 | 343.2 |
In the above example, the
theta-e remains constant with height despite lower mixing ratios due to
elevated heating as shown on a
skewt
chart. Thus, high theta-e air can be acheived on elevated terrain despite
lower moisture content of the air. This helps explain
why storms generally weaken
faster on the high plains after the loss of surface heating compared to
the low-plains or southeast.
On the low-plains, storms
are driven more by moisture which does not have a strong diurnal variation.
Cases
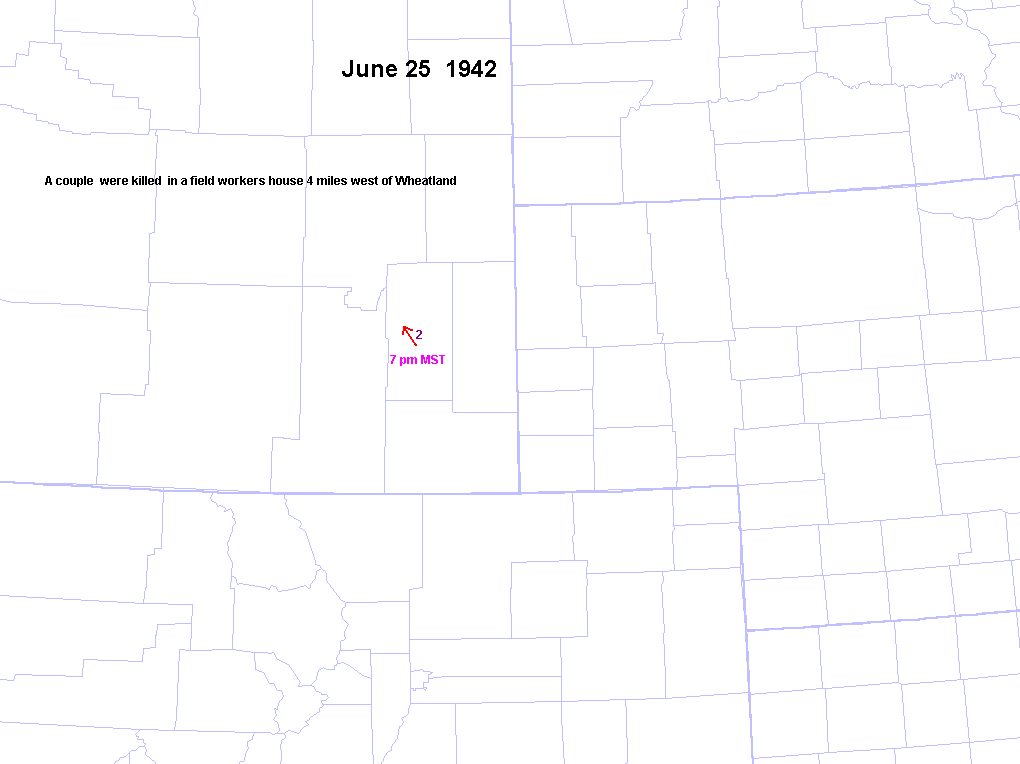
On June 25, 1942 a tornado moved NW killing 2 people in a house 4 miles west of Wheatland, WY. At 1830 UTC
the T/Td were 75F/61F at
Cheyenne, WY and 87F/73F at Tulsa, OK. The theta-e was higher at
Cheyenne than
Tulsa even though the T/Td were
both 12F higher at Tulsa. The weather calculator was down when I tried
to
calculate the MR and theta so I approximated using a skewt.
| Elev(ft) | Pres.(mb) | SLP(mb) | T(F) | Td(F) | MR(g/kg) | theta(F) | theta-e(K) | |
| Cheyenne | 6140 | 808 | 1006.8 | 75 | 61 | 14.4 |
109 | 360.8 |
| Tulsa | 670 | 986 | 1009.5 | 87 | 73 | 17.3 |
89 |
358.3 |
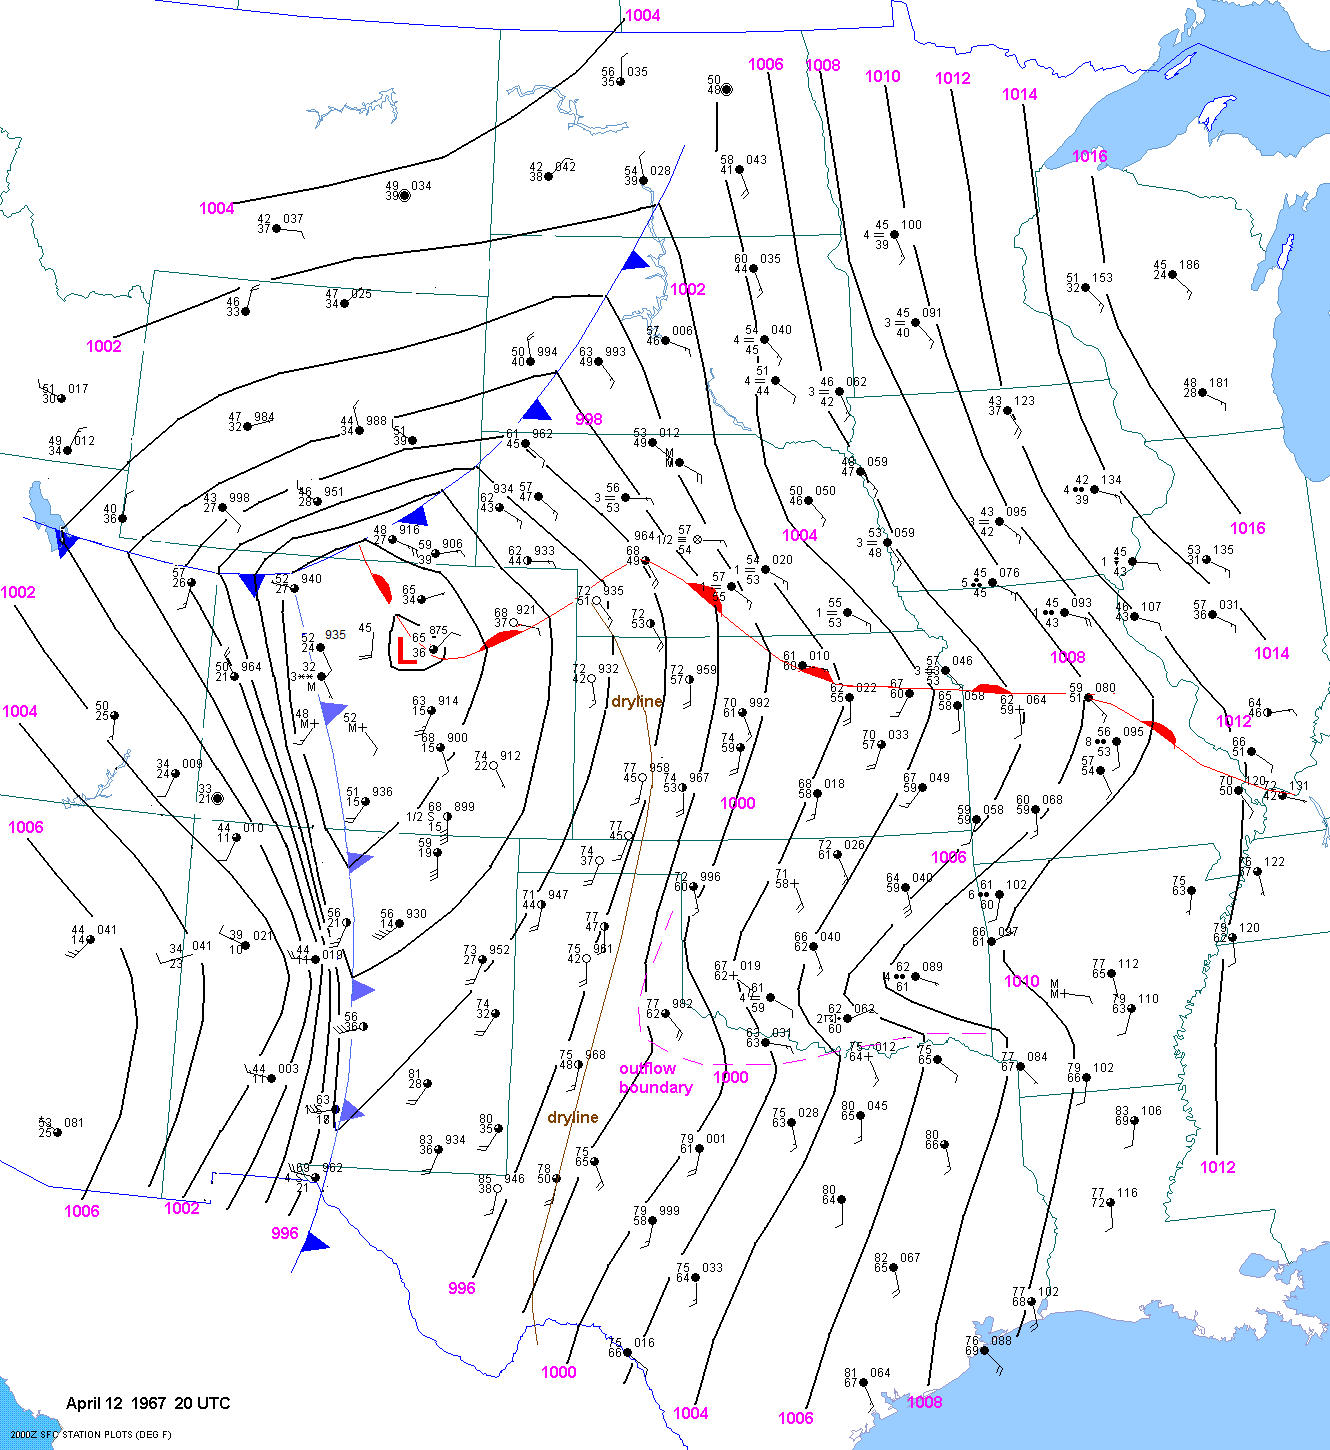
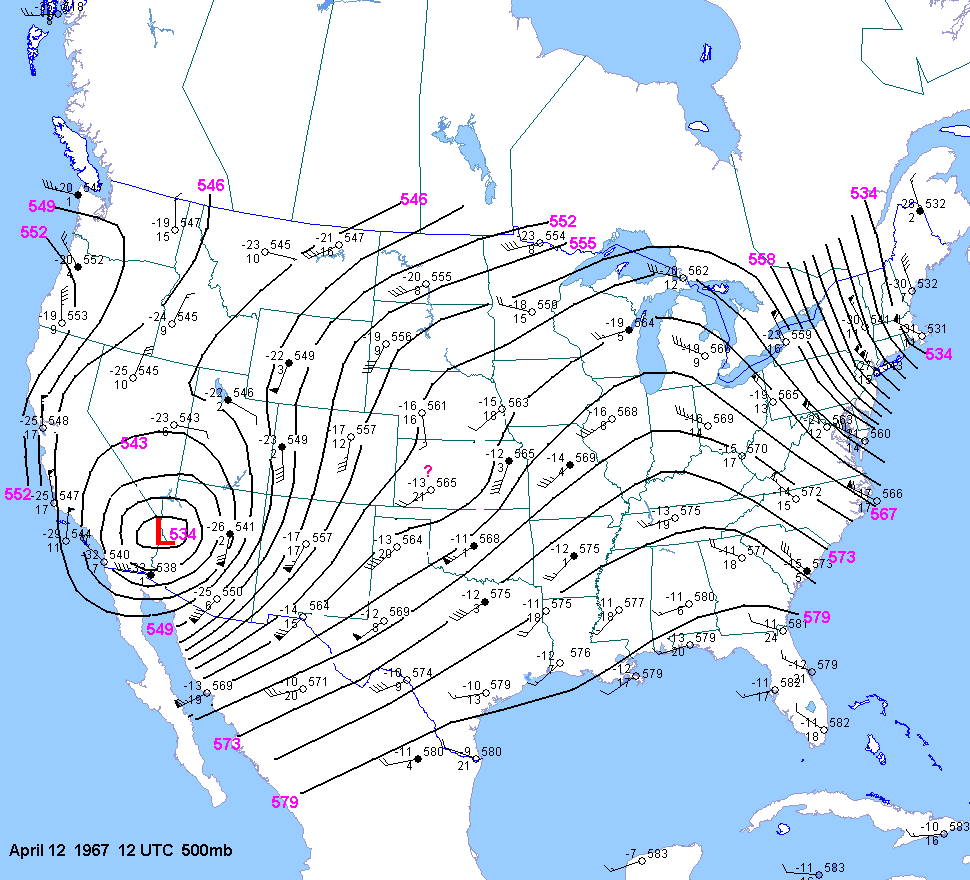
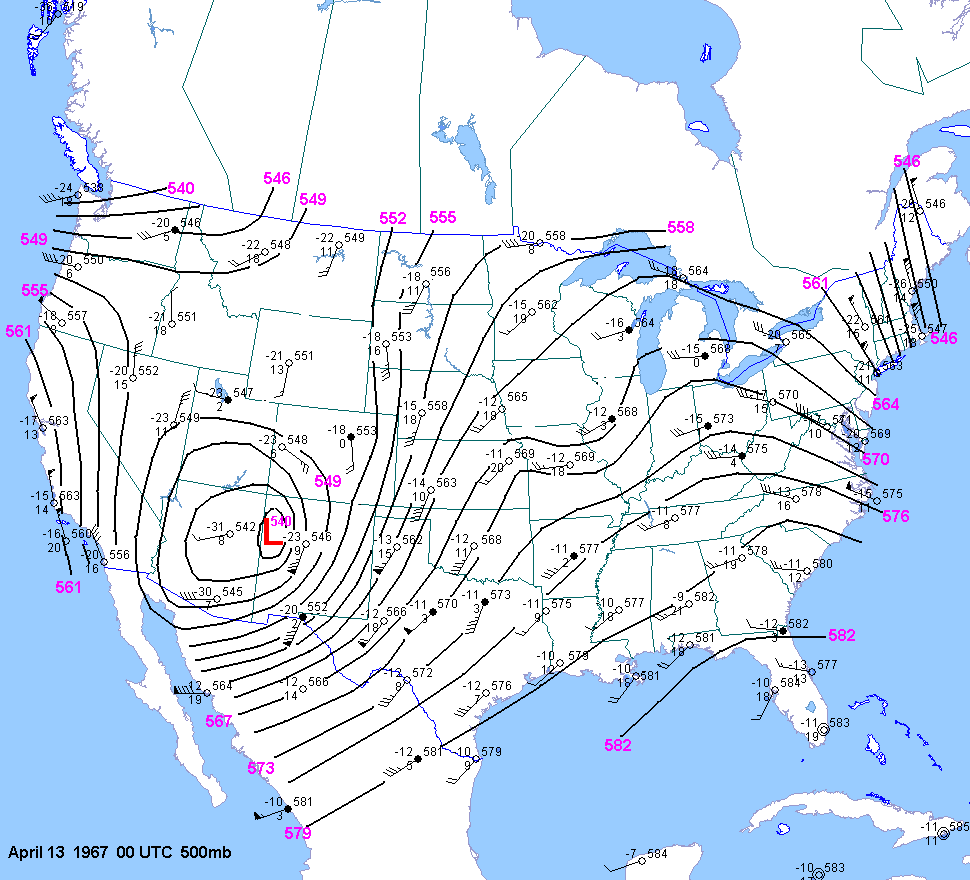
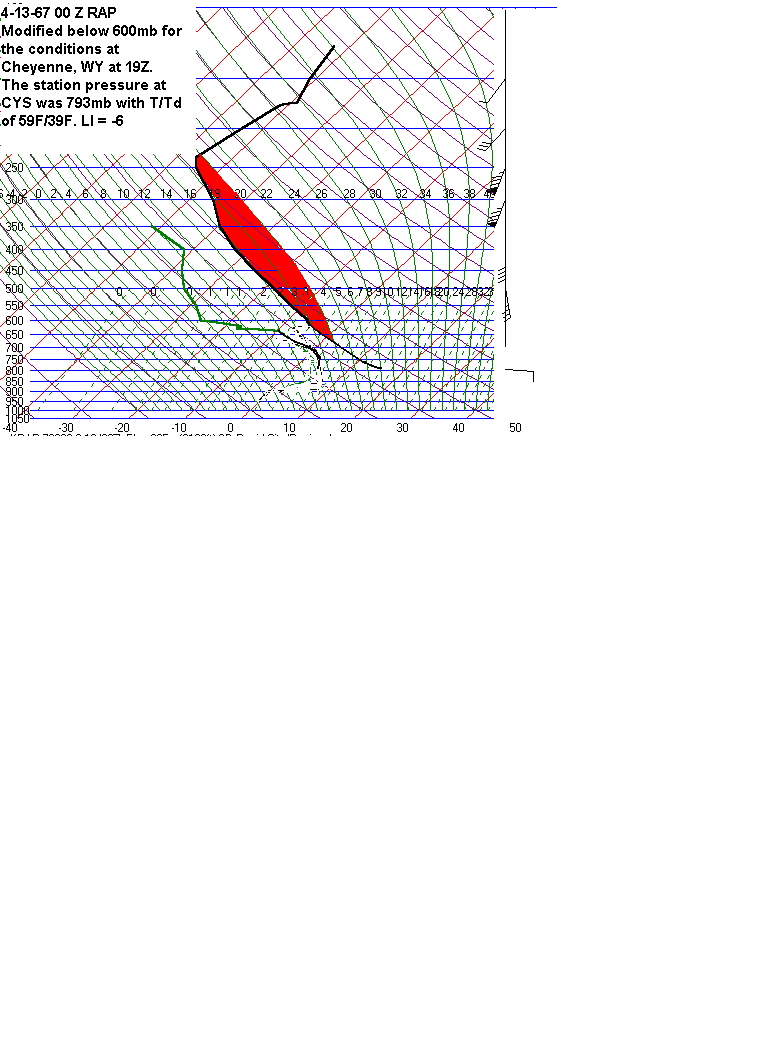
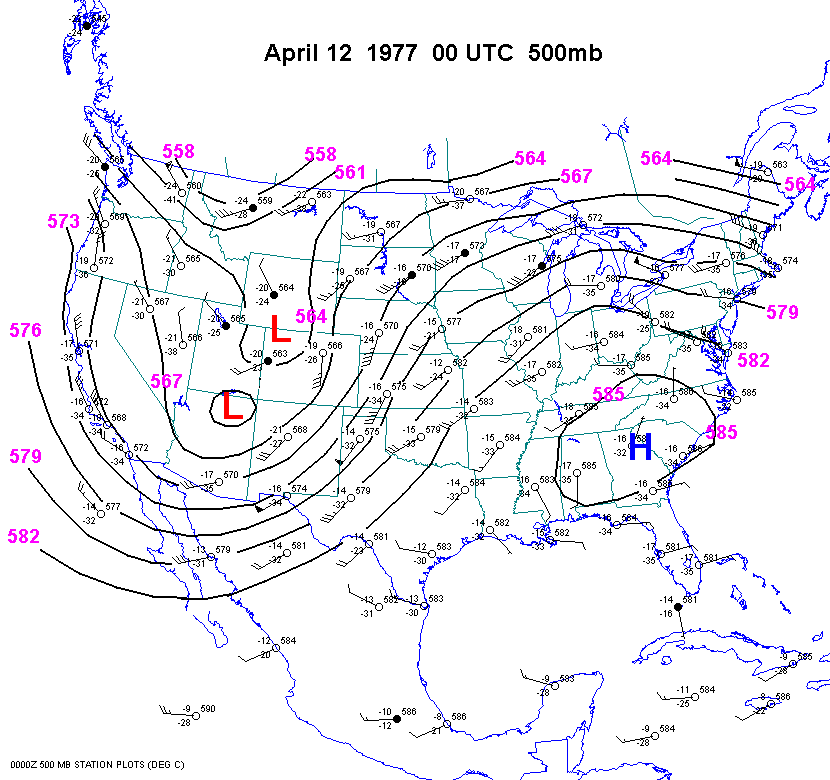
On April
12, 1967 a tornado moved NE then north from SW of Veteran, Wyoming,
causing considerable damage. Dewpoint
temperatures were only in
the upper 30s to mid 40s. At Cheyenne, near the initiation point for the
tornadic storm, the T/Td at
20 UTC were 59F/39F. Low-level
upslope flow was occurring north of a warm front. The station pressure
on the actual
observation form was 793mb.
A 39F dewpoint temperature at Cheyenne has about the same moisture as a
45F dewpoint
at Topeka. Meanwhile, the
T/TD at Topeka were 67F/60F, with a station pressure of 971mb. The elevation
at Topeka is
881 ft compared to 6156
ft at Cheyenne. Despite the T/Td being 8F/21F higher at Topeka, the
equivalent potential
temperature was actually
the same at the two locations--328K! Even though the mixing ratio at Topeka
was 80% higher
than at Cheyenne (11.5 versus
6.4 g/kg), the potential temperature at Cheyenne was 94.5F, compared to
71.4F at Topeka.
Thus, elevated heating overcame
a huge moisture deficit at Cheyenne. Also, the 500mb temperature at Cheyenne
was about
-18C, compared to -12C at
Topeka(see 12Z
and 00Z
500mb charts), resulting in lifted indices of zero at Topeka and -6 at
Cheyenne(note the modified
sounding). Also, notice the southerly mid-level flow that so often
accompanies early season
tornado events on the front
range.
| Elev(ft) | Pres.(mb) | SLP(mb) | T(F) | Td(F) | MR(g/kg) | theta(F) | theta-e(K) | |
| Cheyenne | 6140 | 793 | 990.6 | 59 | 39 | 6.4 | 94.5 | 328 |
| Topeka | 881 | 971 | 1003.3 | 67 | 60 | 11.5 | 71.4 | 328 |
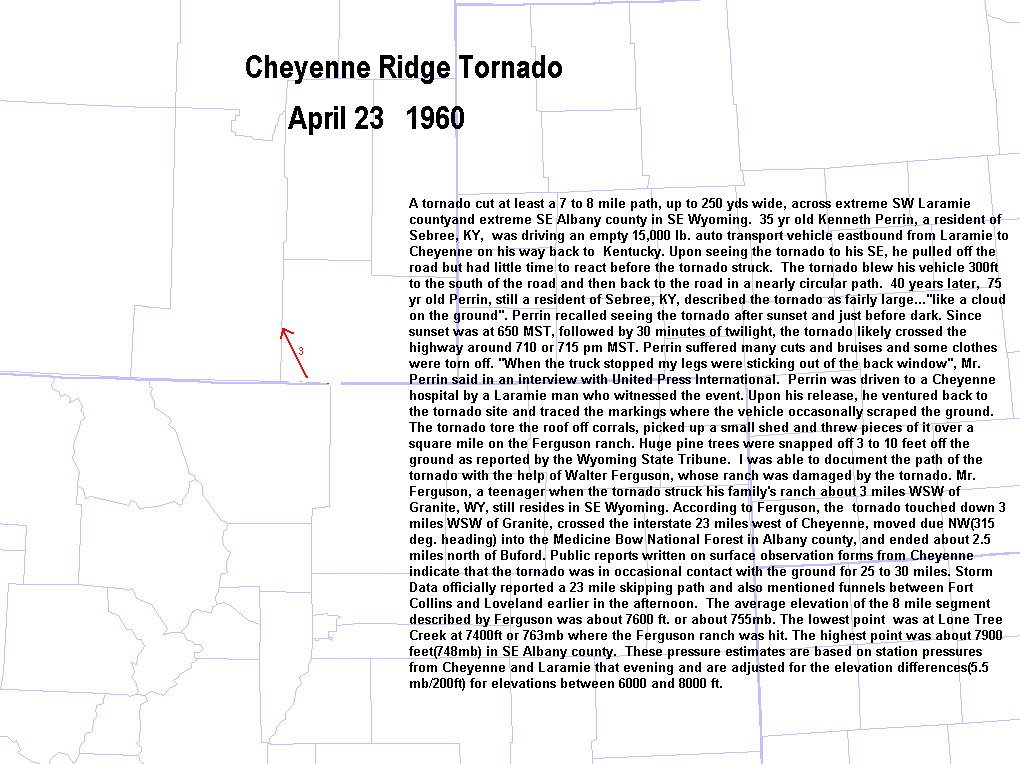
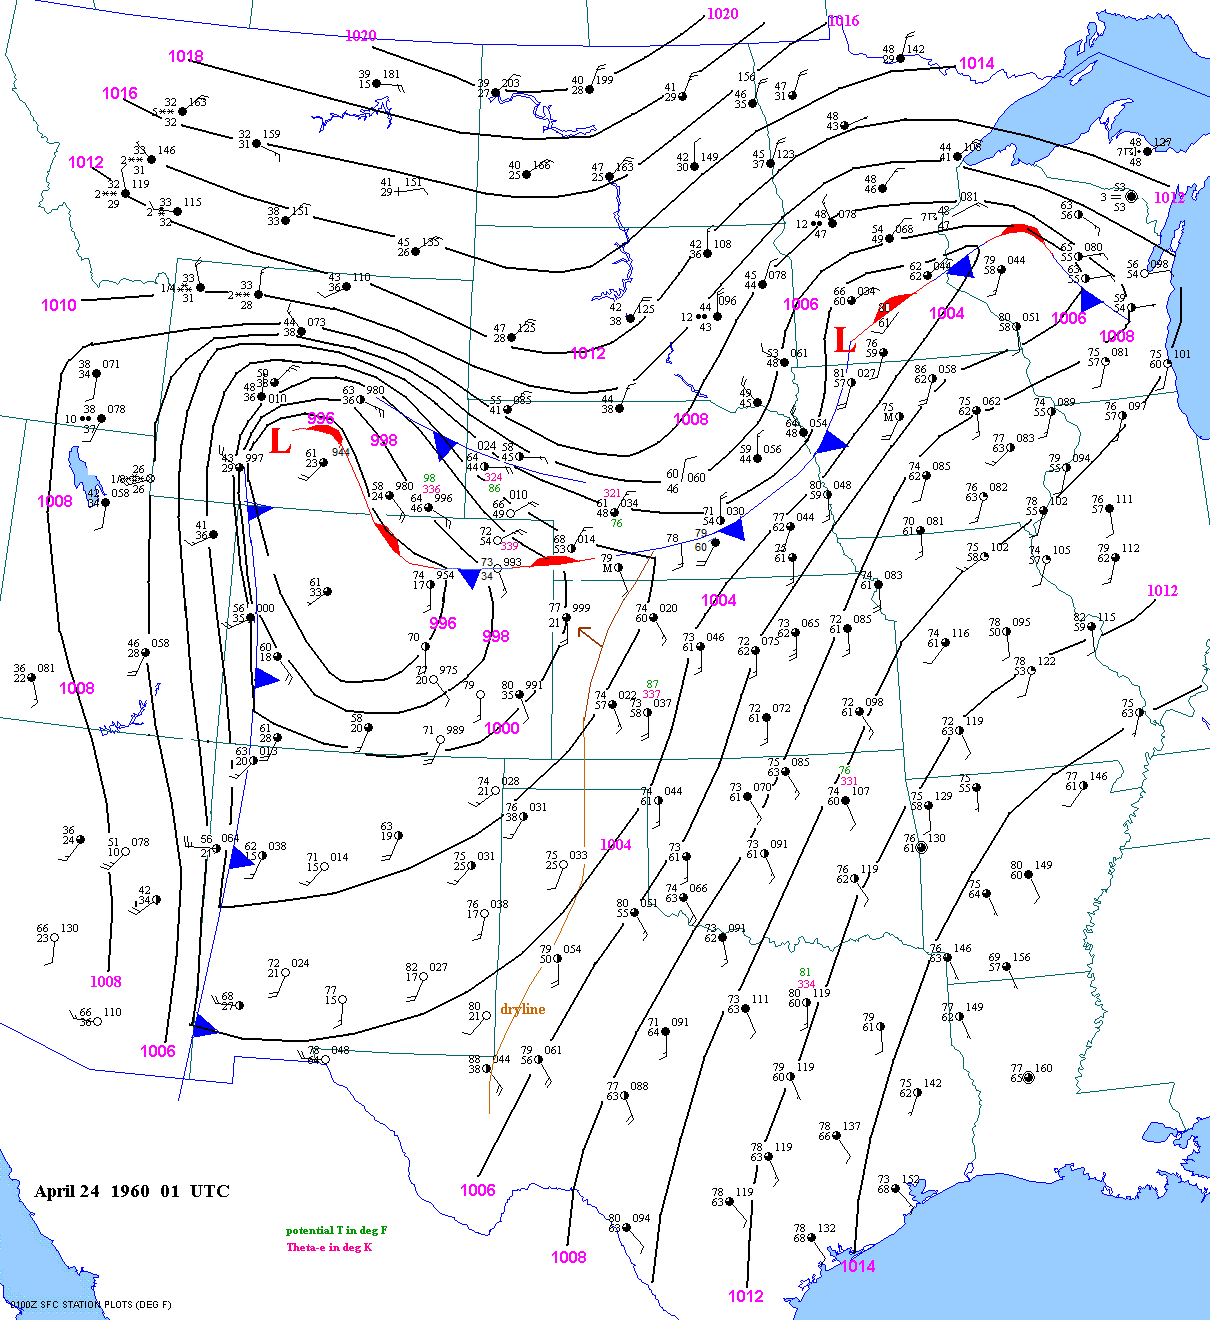
On April
23, 1960, a tornado moved N and NW from 23 miles WSW of Cheyenne
at elevations between 7400 and 7900 ft.
Surface
dewpoints in the area of interest ranged from the lower 40s to
lower 50sF, depending on elevation. Strong upslope
flow was occuring just north
of a warm front. By 01 UTC, the dewpoint at Cheyenne jumped to 46F, with
a temperature of
64F. The station pressure
at Cheyenne at 01 UTC was 801 mb. Meanwhile, at Dallas, TX the temperature
and dewpoint
were 80F/60F, with a station
pressure of 995mb. But the surface theta-e was slightly higher at Cheyenne
compared with
Dallas. The potential
temperature and mixing ratio at Dallas/Cheyenne were 80.8F/98.3F and 11.2
/8.3 g/kg respectively.
So despite the mixing ratio
being 35% higher at Dallas and the temperature being 16F higher, the theta-e
was actually higher
at Cheyenne(335.7K vs 333.5K).
The best way to accomplish high theta-e on high terrain in April is to
have deep,
southerly
flow at and above 700mb, with upslope flow underneath. This helps
steepen lapse rates with warm, moist low-levels
and cool upper levels.
| Elev(ft) | Pres.(mb) | SLP(mb) | T(F) | Td(F) | MR(g/kg) | theta(F) | theta-e(K) | |
| Cheyenne | 6140 | 801 | 999.6 | 64 | 46 | 8.3 | 98.3 |
335.7 |
| Dallas | 487 | 995 | 1011.9 | 80 | 60 | 11.2 | 80.8 | 333.4 |
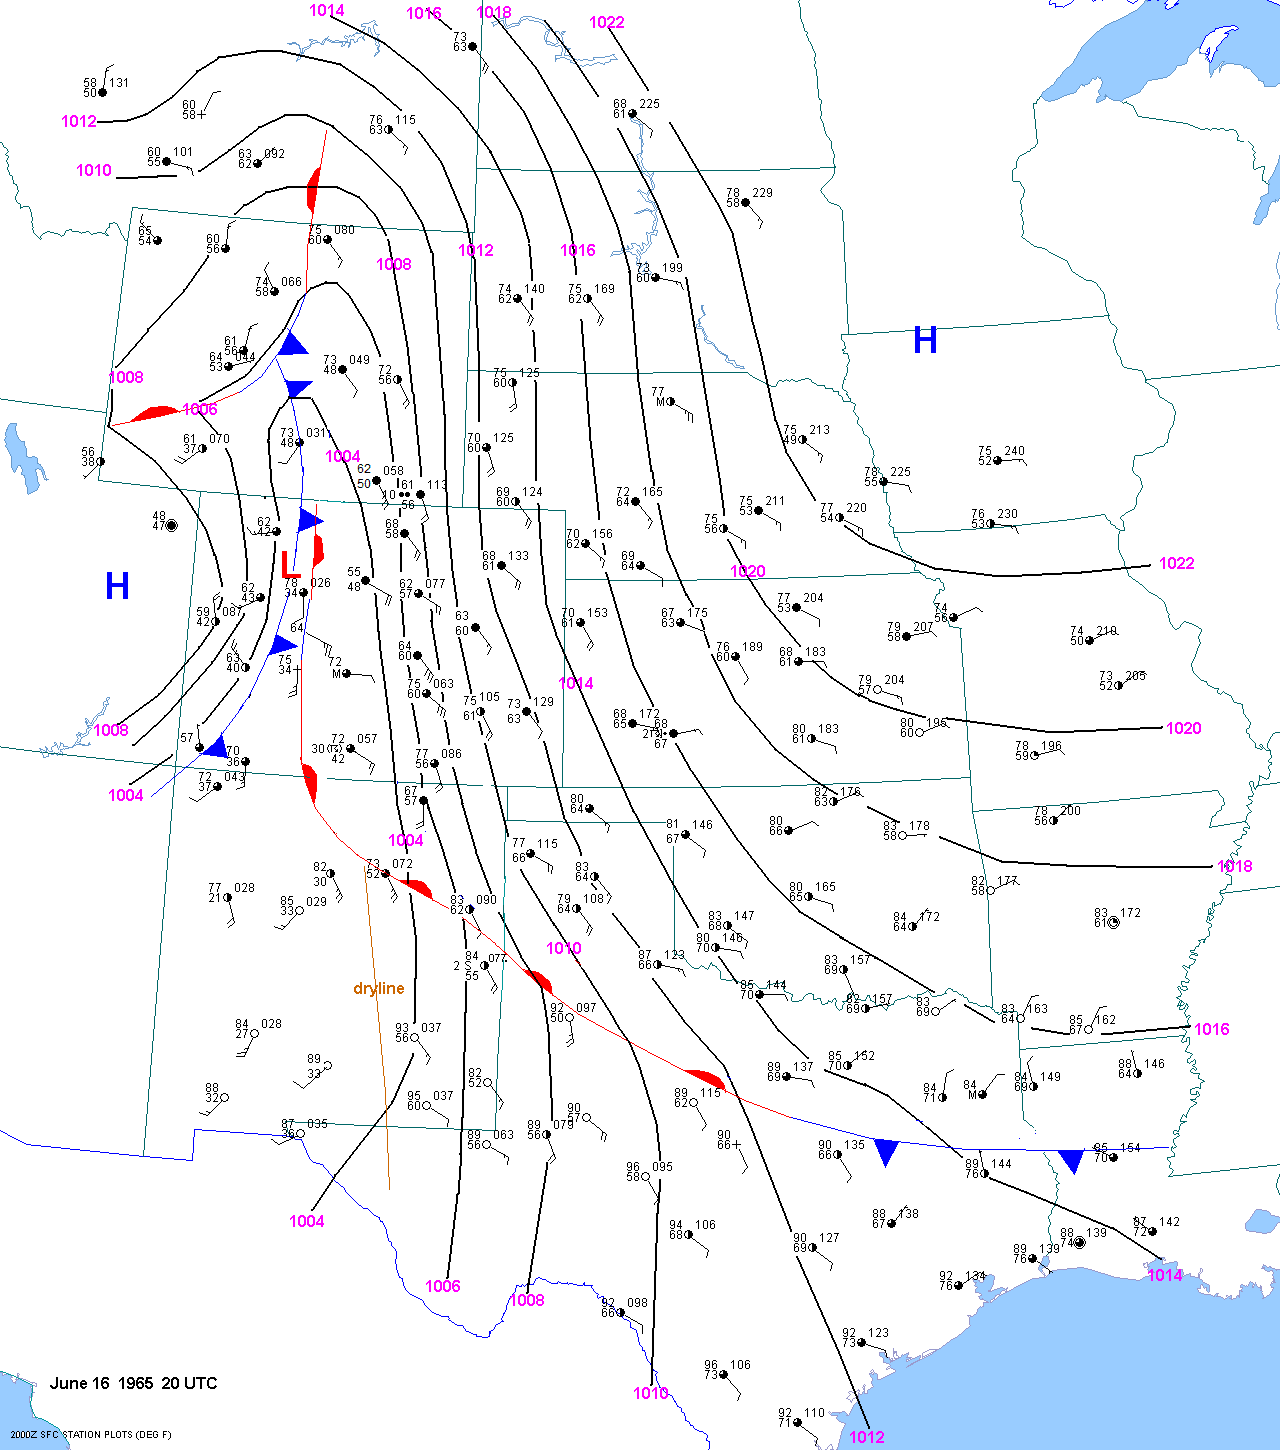
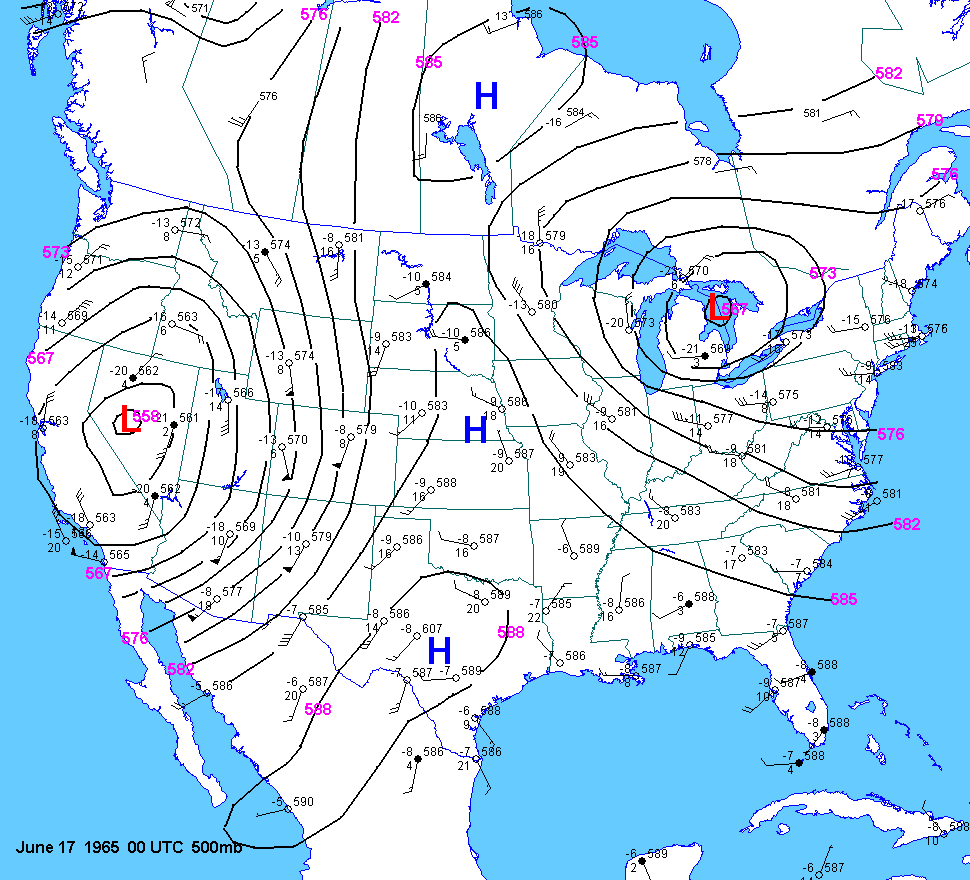
On June
16, 1965 several tornadoes occurred along and west of the urban
corridor in Colorado. The 20
UTC surface map
showed strong southeast
winds advecting moisture onto the front range. The T/TD at Colorado Springs(elevation
6150 ft.)
were 64F/60F. At Dallas
the dewpoint was 70F. But since a 60F dewpoint at COS has the same amount
of moisture as a
66F dewpoint at Dallas,
the mixing ratio at Fort Worth was only 16% higher than at COS. The surface
temperature at
Dallas was 85F compared
to 64F at Colorado Springs. However, the potential temperature was much
higher at Colorado
Springs--96.9F versus 85.8F.
Therefore, the surface theta-e was higher at COS(351.6K versus 350.8K).
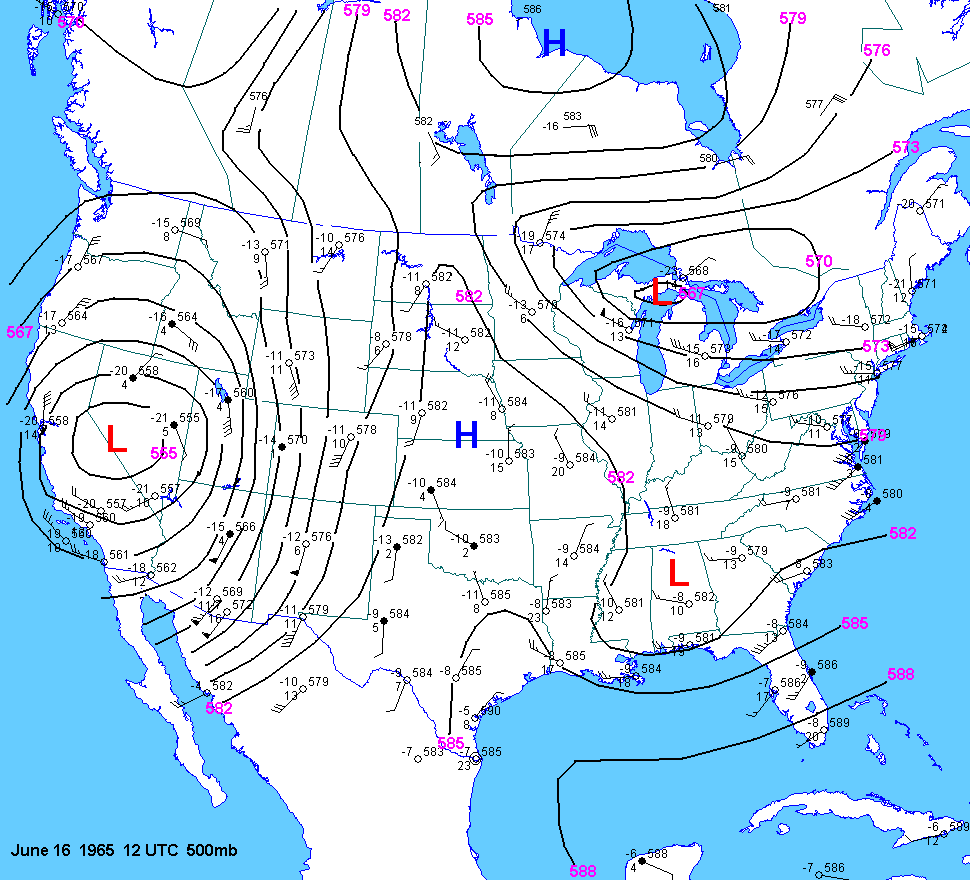
The 500mb charts at
12Z
and 00Z
showed southerly flow up and down the western high plains.
| Elev(ft) | Pres.(mb) | SLP(mb) | T(F) | Td(F) | MR(g/kg) | theta(F) | theta-e(K) | |
| Colo. Springs | 6184 | 808 | 1008.0 | 64 | 60 | 13.9 | 96.9 | 351.6 |
| Dallas | 487 | 994 | 1015.2 | 85 | 70 | 16.1 | 85.8 | 350.8 |
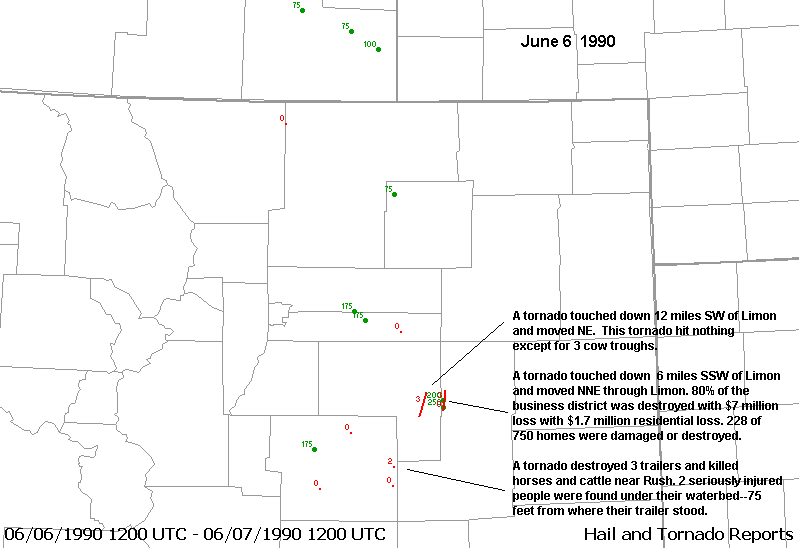
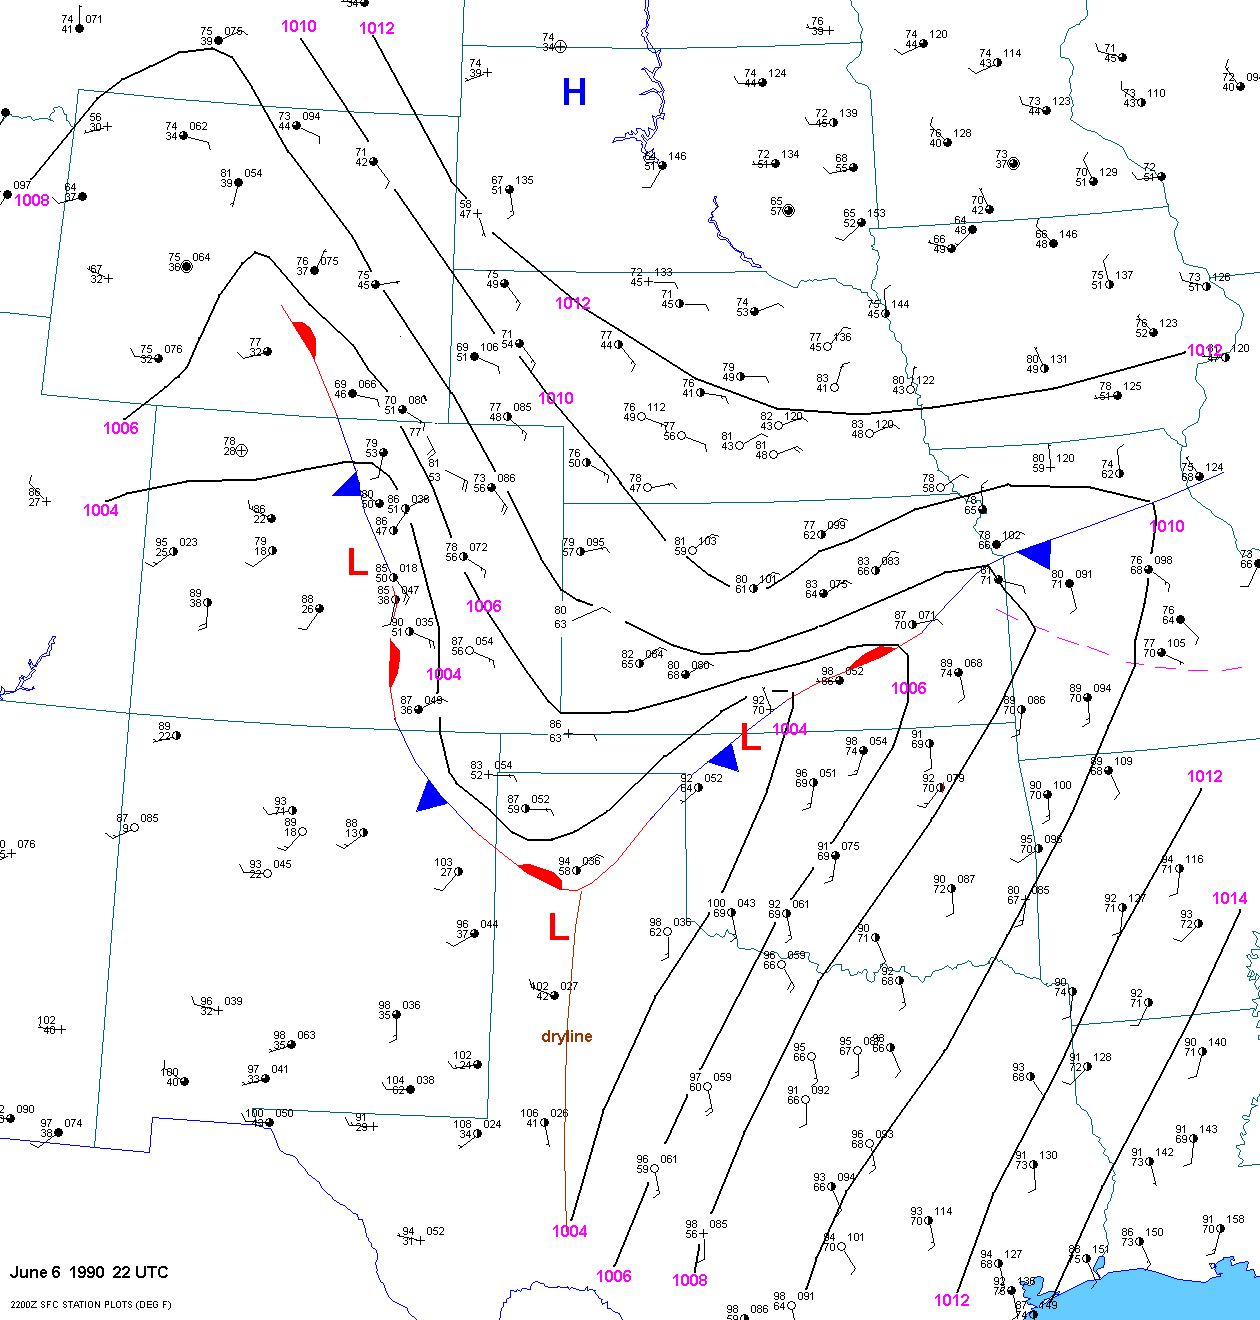
On June
6, 1990, an elevated
mixed layer covered the western plains with 700mb temps from 15
to 19C. However, strong
upslope
flow and elevated heating, along with convergence on the Palmer
Divide, helped initiate convection. The T/TD at
Limon, CO(elevation 5300ft)
were 78F/56F. The T/TD were much higher at Dallas(95F/67F). However, the
theta-e was
only slightly higher at
Dallas(351.2K versus 353.6K). This is because the potential temperature
at Limon was actually
much higher than at Dallas(106.7F
versus 96.7F). The mixing ratio at Dallas was 25% higher than at Limon.
A strong tornado struck
Limon.
| Elev(ft) | Pres.(mb) | SLP(mb) | T(F) | Td(F) | MR(g/kg) | theta(F) | theta-e(K) | |
| Limon | 5300 | 833 | 1007.2 | 78 | 56 | 11.6 | 106.7 | 351.2 |
| Dallas | 487 | 989 | 1008.7 | 95 | 67 | 14.5 | 96.7 | 353.6 |
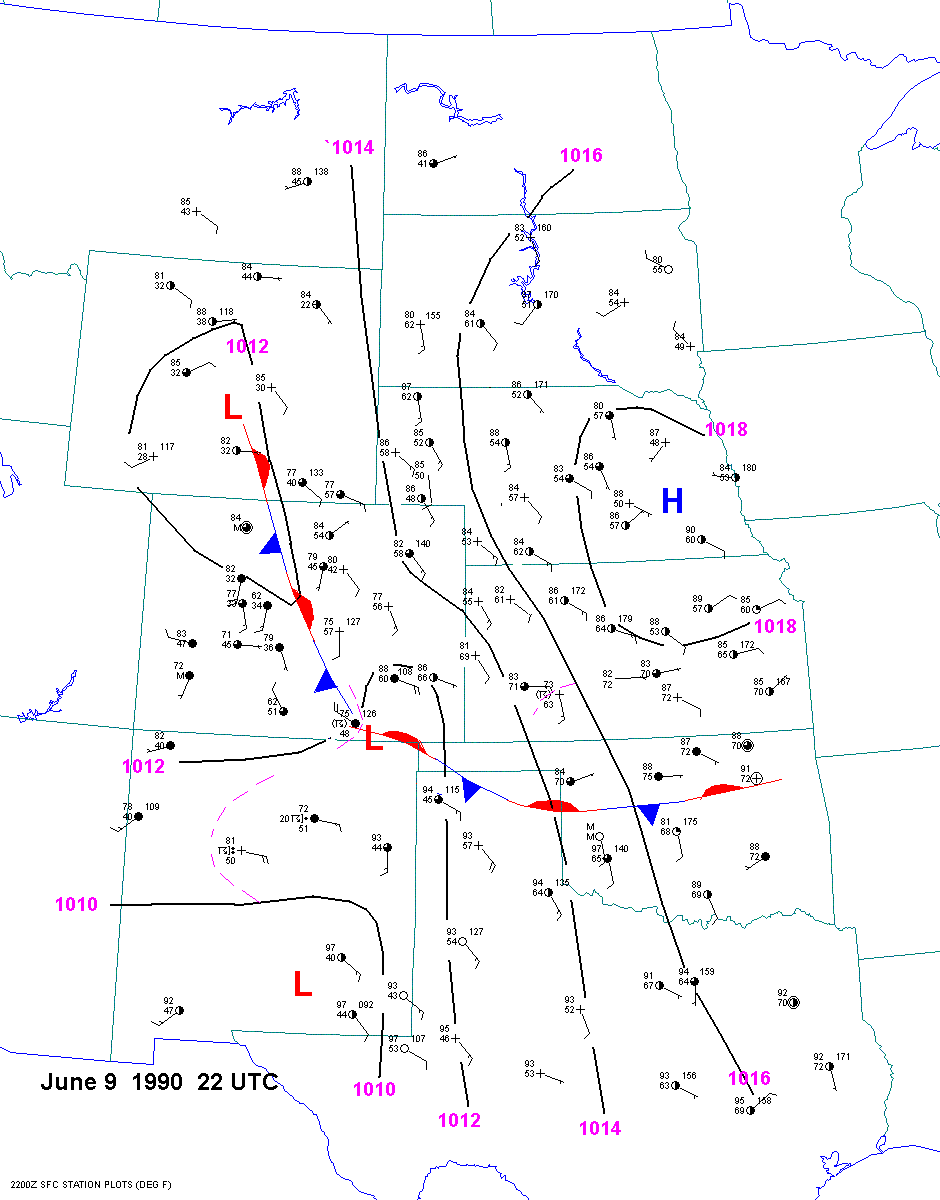
On June
9, 1990, tornadoes occurred in Weld county Colorado, which is just
south of Cheyenne, Wyoming. At 22
UTC the
T/TD's were: CYS(77F/57F),
Fort Worth(94F/64F), Topeka(85F/60F), and Chanute, KS(85F/70F). Out of
these 4 stations,
the theta-e was highest
at Cheyenne(355.7K) compared to Fort Worth(348.8K), Topeka(338.5K) and
Chanute(353.6K).
Mixing ratios were as follows:
Cheyenne(12.4g/kg), Fort Worth(13.1g/kg), Topeka(11.4g/kg), and Chanute(16.3g/kg).
Note that the mixing ratio
was higher at Cheyenne than Topeka despite a lower dewpoint. Also note
that the potential
temperature was 110F at
Cheyenne, compared to 94.2F at Fort Worth, 88F at Topeka and 88F at Chanute.
| Elev(ft) | Pres.(mb) | SLP(mb) | T(F) | Td(F) | MR(g/kg) | theta(F) | theta-e(K) | |
| Cheyenne | 6140 | 810 | 1011 | 77 | 57 | 12.4 | 110.1 | 355.7 |
| Topeka | 881 | 981 | 1018 | 85 | 60 | 11.4 | 88 | 338.5 |
| Chanute | 1020 | 978 | 1017 | 85 | 70 | 16.3 | 88 | 353.6 |
| Fort Worth | 700 | 987 | 1016 | 94 | 64 | 13.1 | 96.1 | 348.8 |
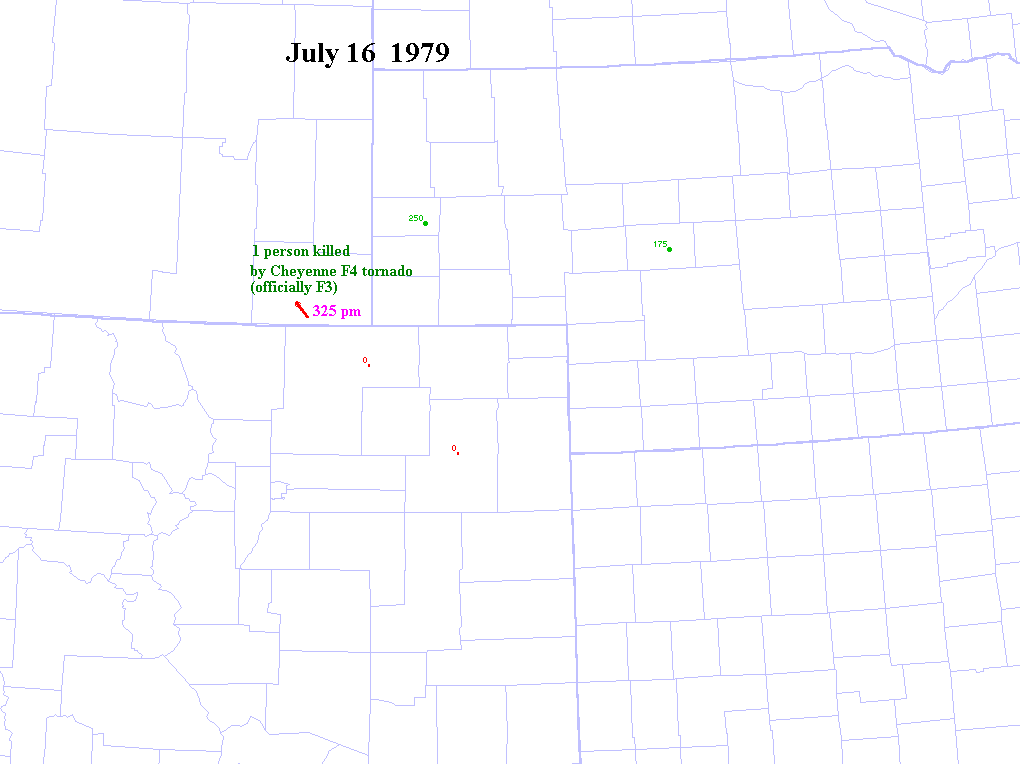
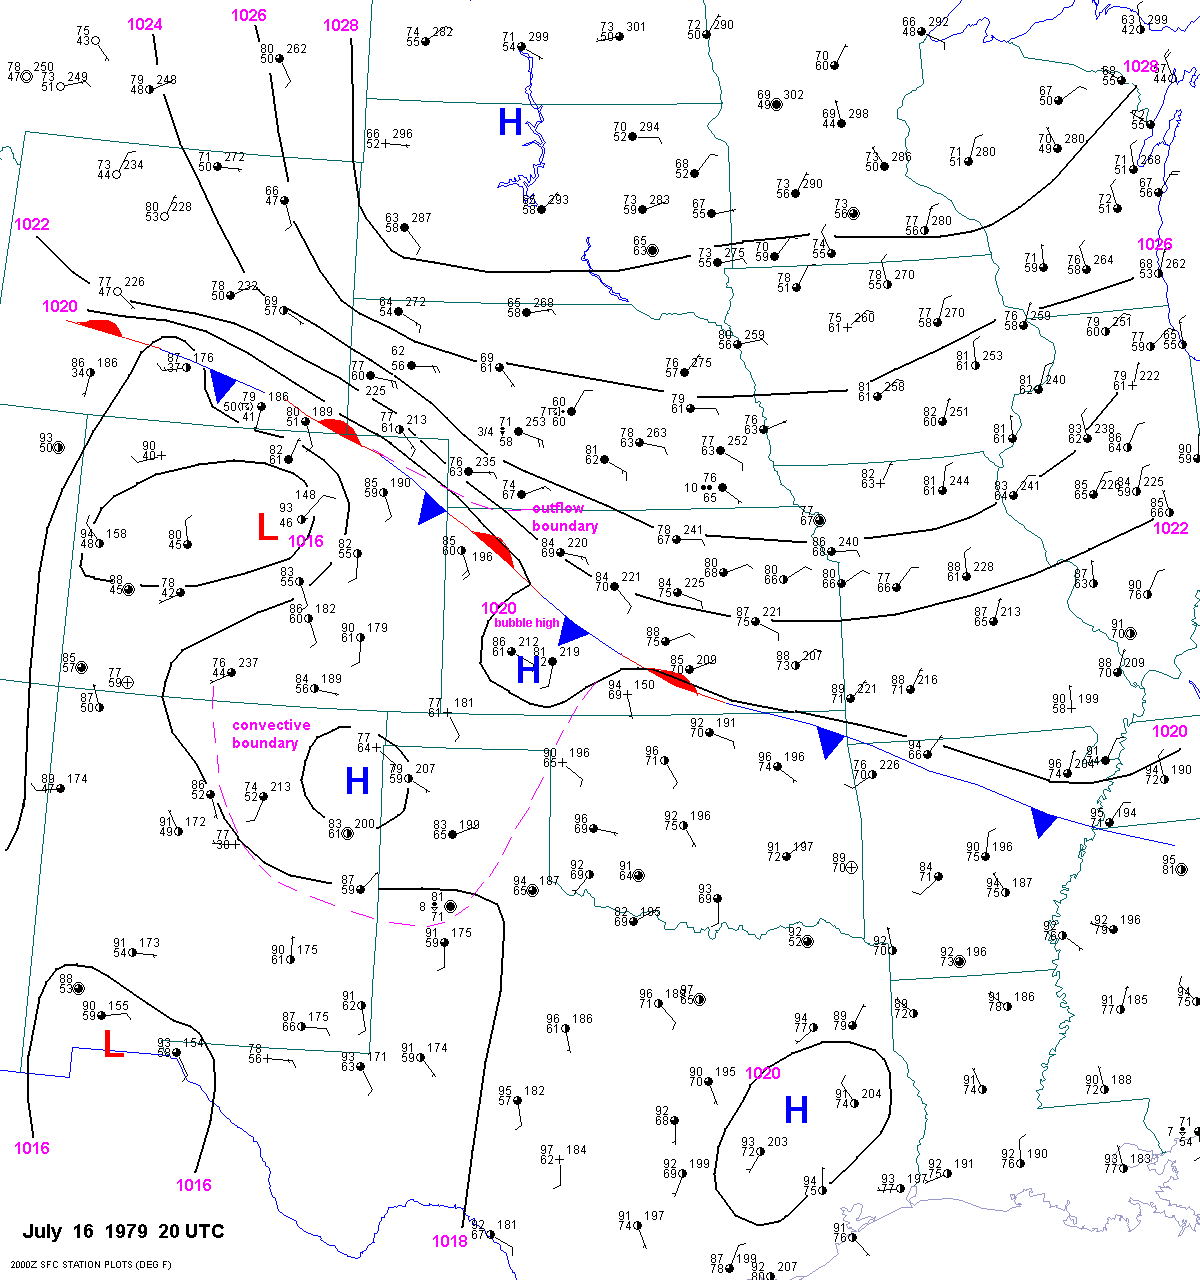
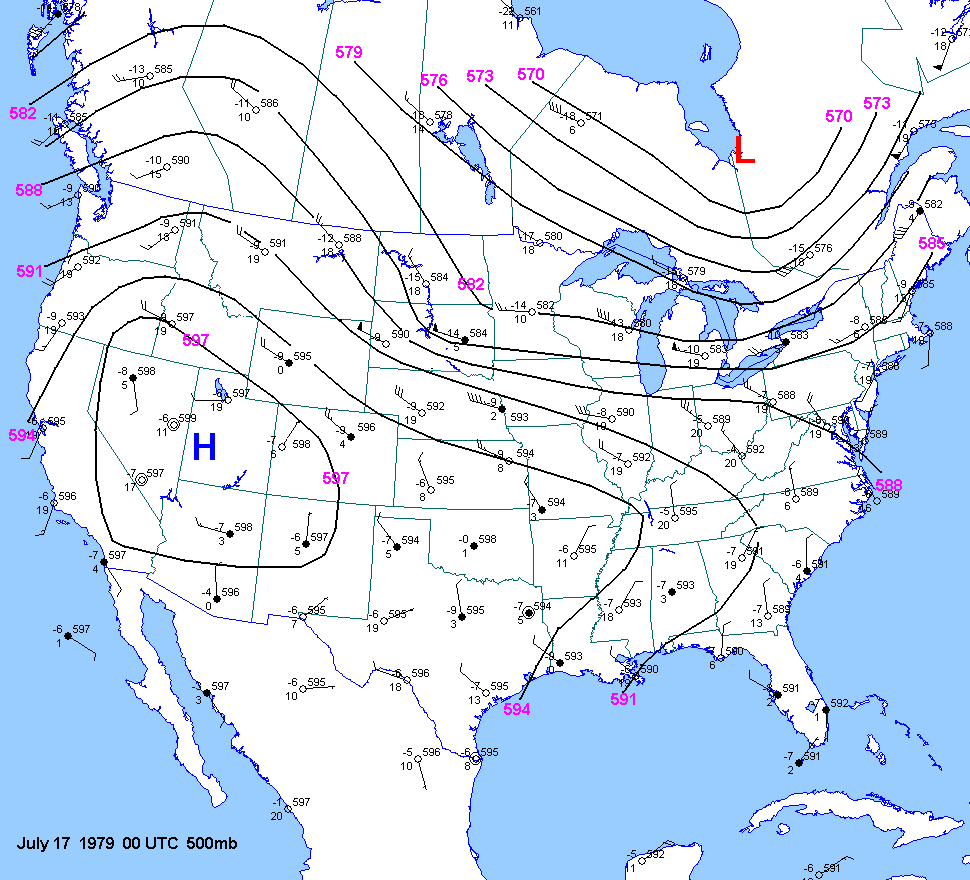
On July
16, 1979, an F4 tornado struck Cheyenne, Wyoming. There was likely
a strong moisture gradient across the city of
Cheyenne. The T/TD at Cheyenne
airport were 80F/51F at 20
UTC, compared to 82F/70F at Topeka and 97F/64F at
Fort Worth. The mixing ratios
were 9.5g/kg at Cheyenne, 16.2g/kg at Topeka and 12.8g/kg at Fort Worth.
Despite the
mixing ratio being 70% higher
at Topeka than Cheyenne and the tempertaure being about the same, the theta-e
was nearly
the same at the three locations--348.5K
at Cheyenne vs 349.9K at Topeka and 349.4 at DFW. This is because the potential
temperature was much higher
at Cheyenne(113.1F), compared to 83.9F at Topeka. The 500mb
chart showed NW flow
across the plains.
| Elev(ft) | Pres.(mb) | SLP(mb) | T(F) | Td(F) | MR(g/kg) | theta(F) | theta-e(K) | |
| Cheyenne | 6140 | 817 | 1019.0 | 81 | 50 | 9.5 | 113.1 | 348.5 |
| Topeka | 881 | 988 | 1023.6 | 82 | 70 | 16.2 | 83.9 | 349.9 |
| Dallas(DFW) | 660 | 996 | 1019.2 | 97 | 64 | 13.0 | 97.6 | 349.4 |
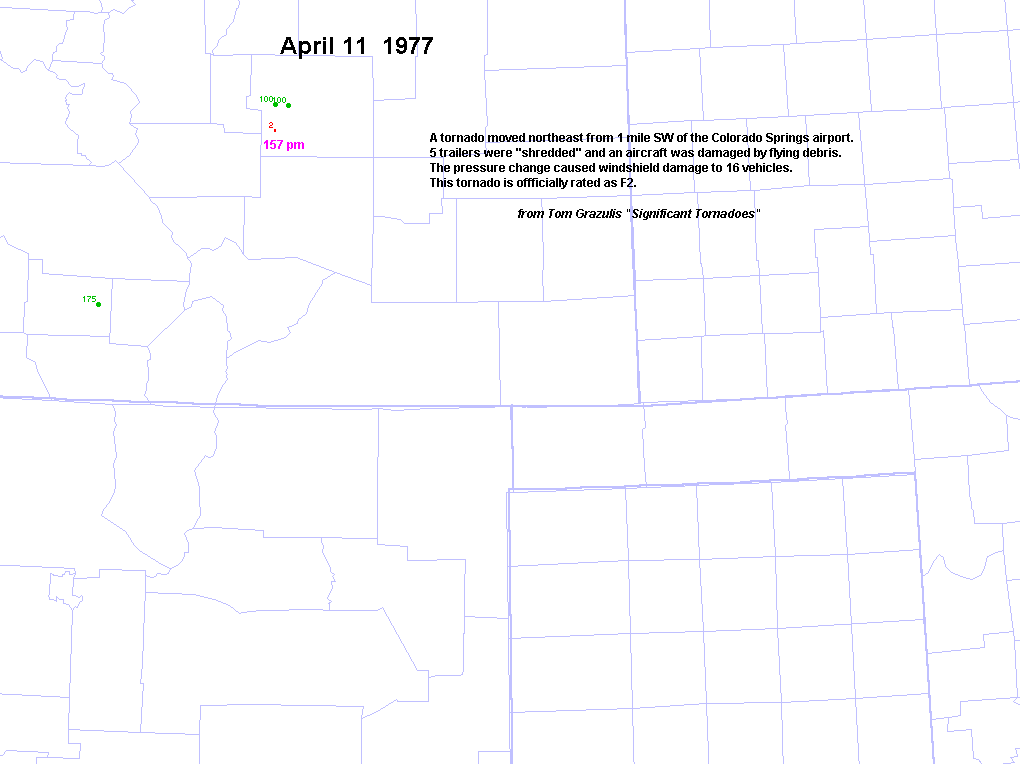
On April
11, 1977, a F2 tornado hit near Colorado Springs(COS). The T/TD
at 20
UTC were 58F/41F at Colorado Springs,
with strong upslope surface
winds at 20kts, 81F/40F at Topeka, 83F/45F at Omaha, and 81F/55F at Fort
Worth. Despite
dewpoints being nearly identical
at Topeka and COS(40F vs 41F), the mixing ratio was 28% higher at COS compared
to
Topeka (5.3 vs 6.8g/kg).
Despite the low temperature of 58F at Colorado Springs, the potential temperature
was 90F, compared
to 83F at Topeka, 86F at
Omaha and 81.5F at Fort Worth. The theta-e was higher at Colo. Springs
than Topeka or Omaha.
The theta-e was only slightly
higher at DFW(328.4K) than COS(326.2K). The 500mb
chart showed a deep upper trough over
the southern rockies with
meridional flow up the high plains.
| Elev(ft) | Pres.(mb) | SLP(mb) | T(F) | Td(F) | MR(g/kg) | theta(F) | theta-e(K) | |
| Colo. Springs | 6140 | 810 | 1008 | 58 | 41 | 6.8 | 90 | 326.2 |
| Topeka | 881 | 987 | 1021.6 | 81 | 40 | 5.3 | 83 | 317.8 |
| Omaha | 980 | 981 | 1017.4 | 83 | 45 | 6.5 | 86 | 323 |
| Dallas(DFW) | 660 | 997 | 1022.6 | 81 | 55 | 9.2 | 81.5 | 328.4 |
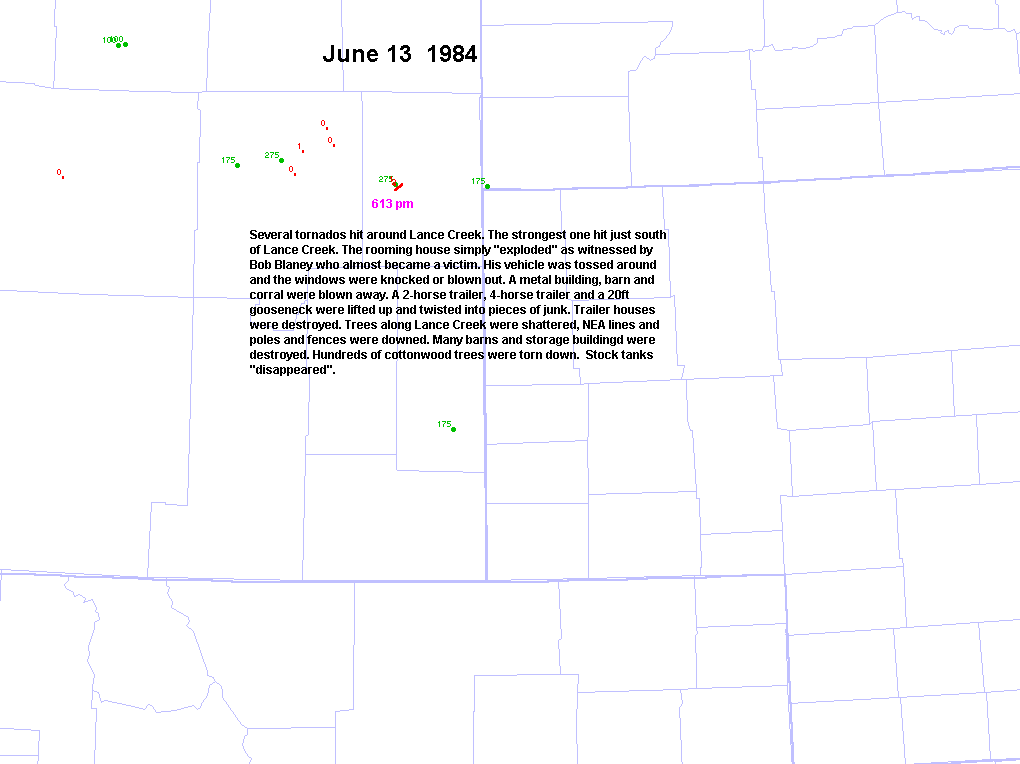
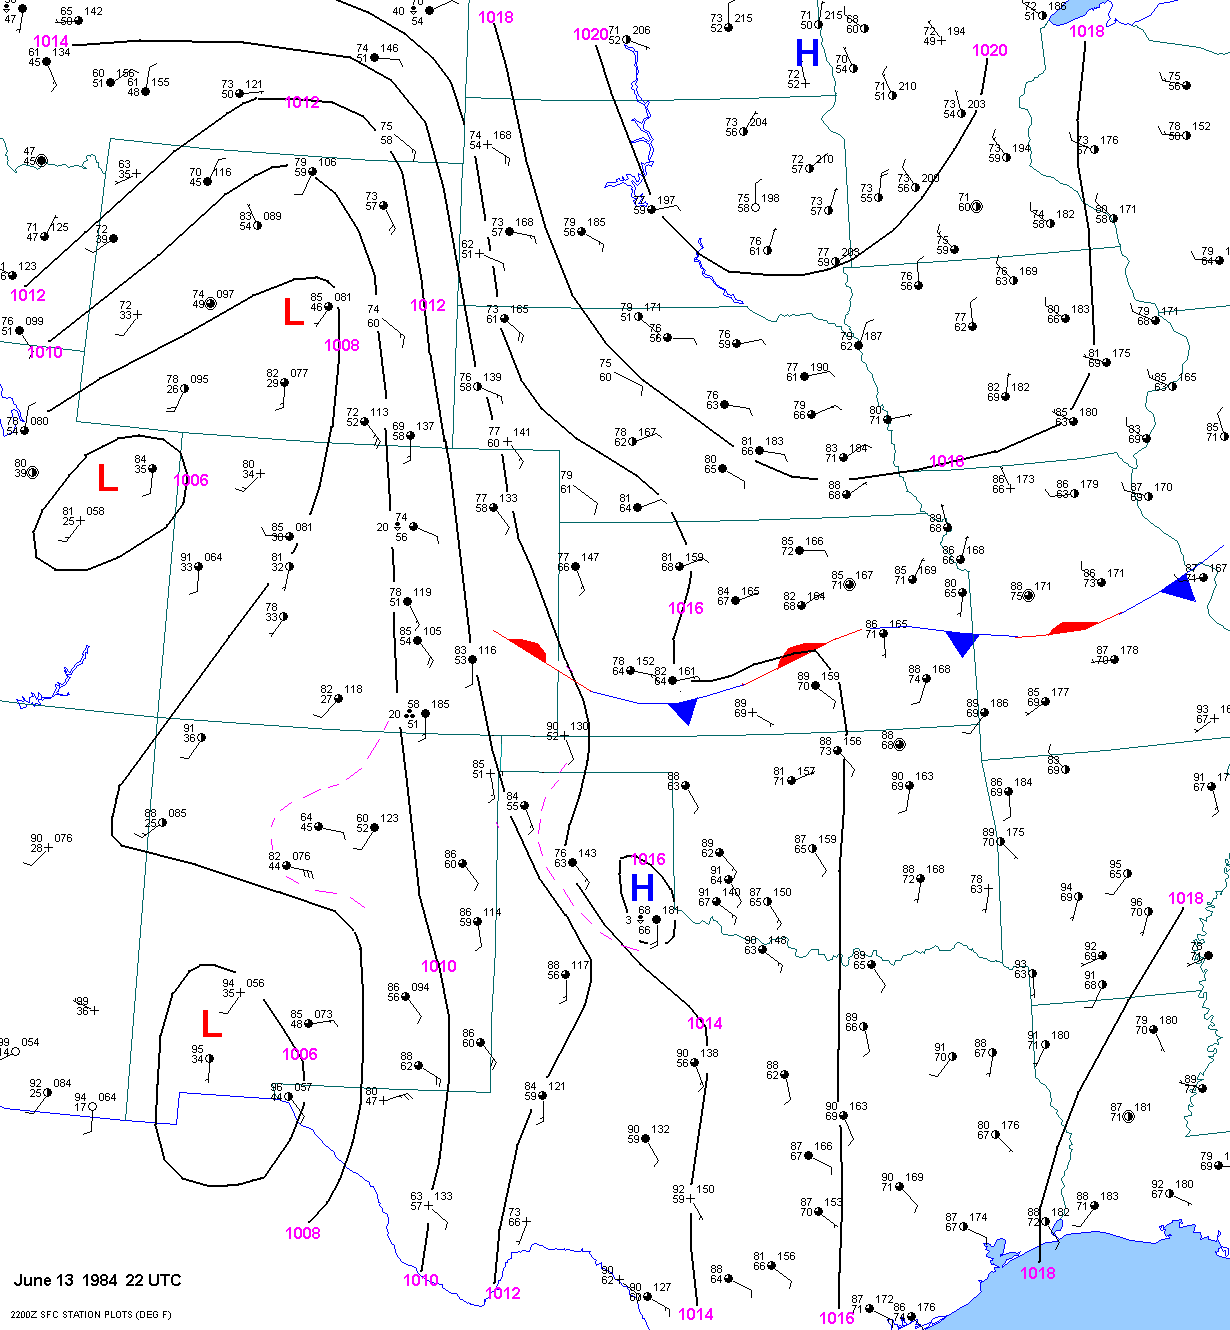
On June
13, 1984, a tornado struck near Lance Creek in east-central Wyoming.
Theta-e values were fairly uniform across
eastern Wyoming at 22
UTC, despite differing T/TD values. For example, the dewpoint was
only 52F at Laramie, 58F at
Cheyenne and 60F at Douglas.
But note that the potential temperature was much higher at Laramie, which
made up for the lack of
moisture. Also note that
the theta-e was higher at Laramie than Little Rock, despite the T/Td being
23F/13F lower.
| Elev(ft) | Pres.(mb) | SLP(mb) | T(F) | Td(F) | MR(g/kg) | theta(F) | theta-e(K) | |
| Laramie | 7240 | 780 | 1011.3 | 72 | 52 | 10.7 | 111.1 | 351.1 |
| Cheyenne | 6140 | 816 | 1013.7 | 69 | 58 | 12.8 | 100.6 | 350.7 |
| Douglas | 4970 | 845 | 1010.7 | 73 | 60 | 13.3 | 99.2 | 351.3 |
| Dodge City | 2600 | 927 | 1016.1 | 82 | 64 | 13.9 | 93.8 | 349.9 |
| Little Rock | 262 | 1009 | 1017.6 | 95 | 65 | 13.2 | 93.6 | 347.7 |
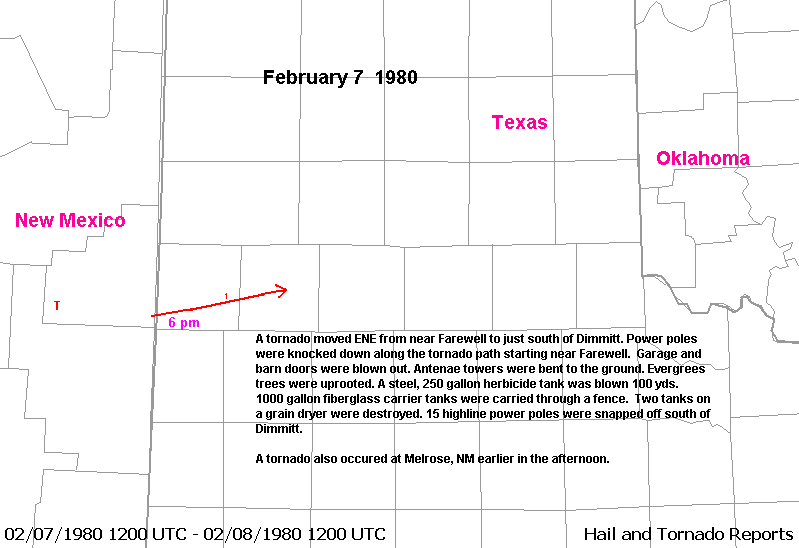
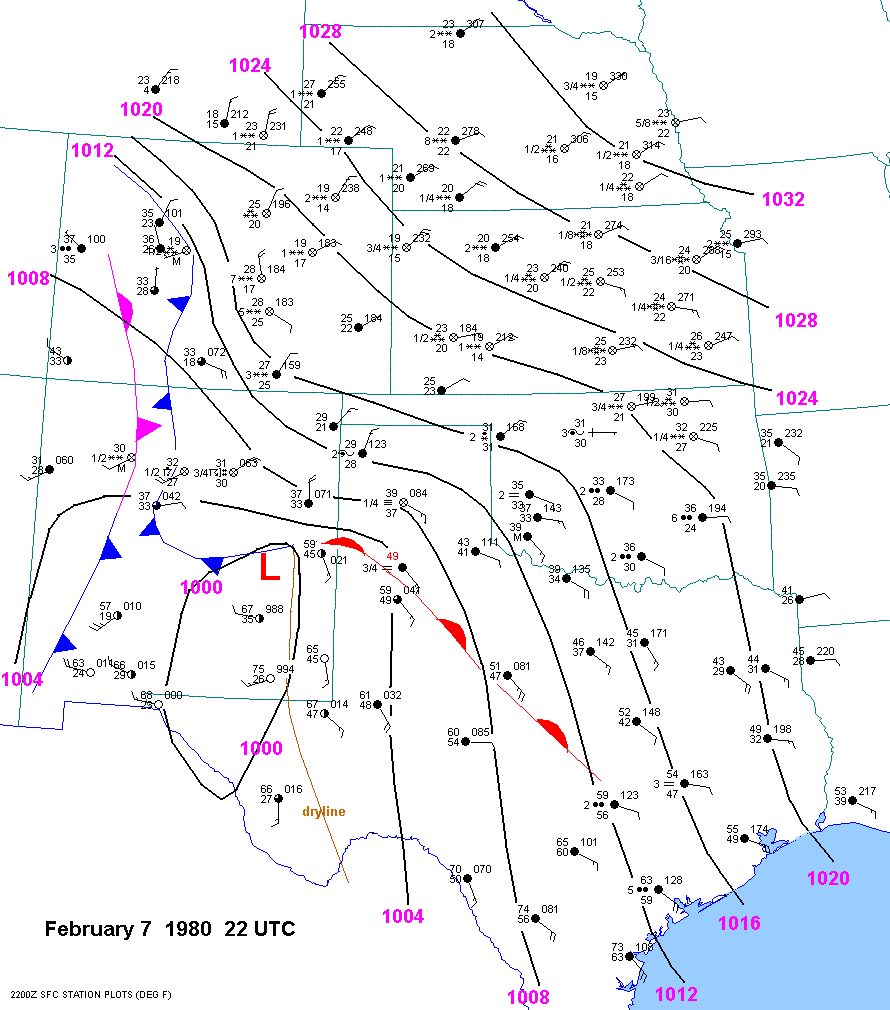
On February
7, 1980 a tornado moved from Farewell, TX(near the New Mexico state
line) to just south of Dimmitt, TX. A
tornado was also reported
near Melrose, NM. At 22
UTC the T/Td at Clovis, NM was 59F/45F. The T/TD were 63F/59F at
Victoria, TX and 65F/60F
at San Antonio, TX. Despite the much lower T/Td at Clovis, the theta-e
was actually higher at Clovis
than Victoria, and only
slighly lower than San Antonio. This is despite a much lower mixing ratio.
But note the much higher potential
temperature at Clovis.
| Elev(ft) | Pres.(mb) | SLP(mb) | T(F) | Td(F) | MR(g/kg) | theta(F) | theta-e(K) | |
| Clovis | 4295 | 854 | 1002 | 59 | 45 | 7.5 | 82.9 | 324 |
| San Antonio | 809 | 982 | 1010.1 | 65 | 60 | 11.4 | 67.7 | 325.6 |
| Victoria | 130 | 1008.4 | 1012.8 | 63 | 59 | 10.7 | 61.8 | 319.9 |
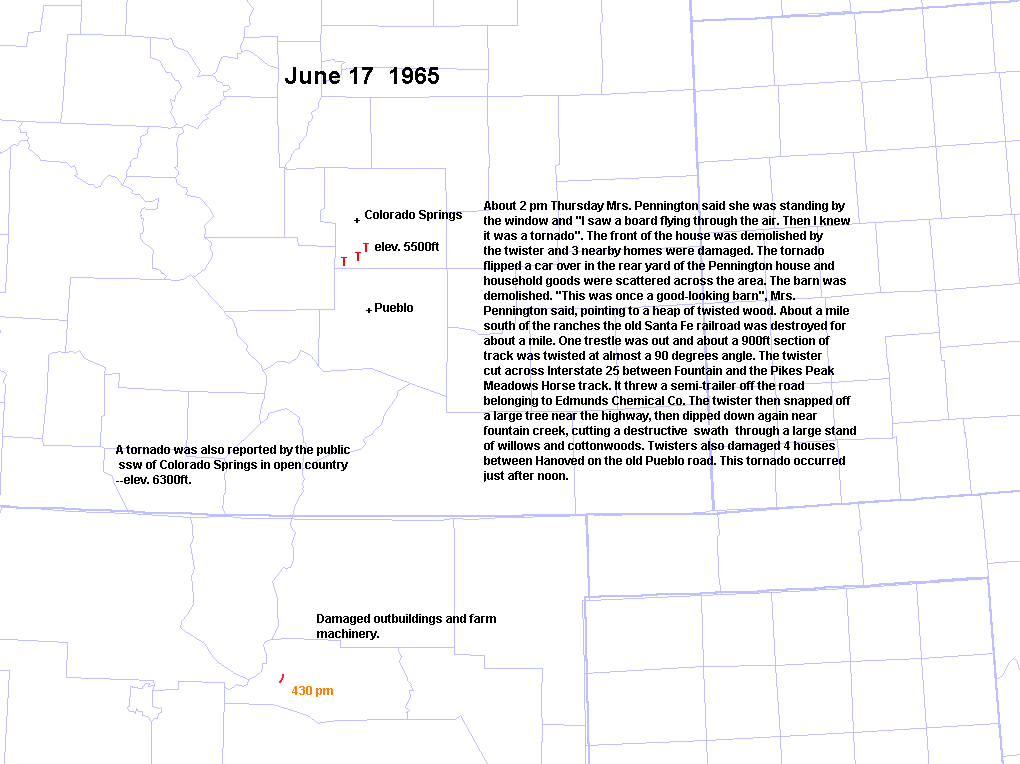
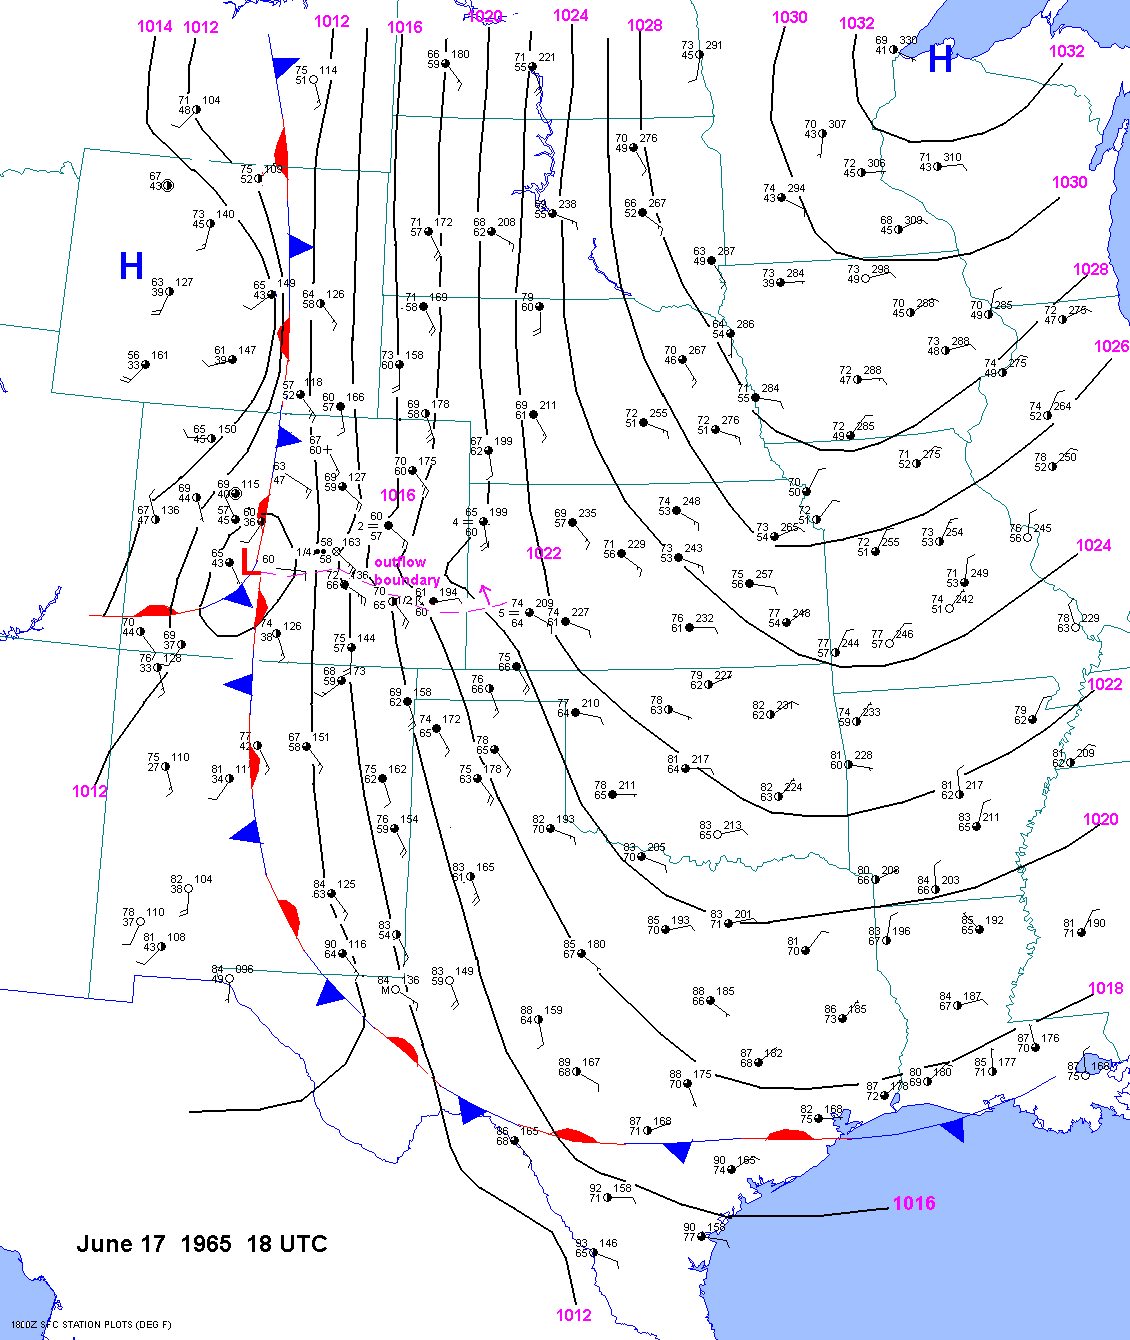
On June
17, 1965 several tornadoes occured along the front range in Colorado.
The T/TD at Pueblo was 72F/66F at 18
UTC.
This is about as high as
the dewpoint ever gets at 4700ft. In fact, a 66F dewpoint at Pueblo has
nearly the same mixing ratio as a 71F
dewpoint at Dallas, TX.
The T/Td at Dallas and Victoria were 83F/71F and 90/74 respectively. The
theta-e was higher at Pueblo
than Dallas and about the
same as Victoria. This is despite the T/TD being 18F/8F higher at Victoria.
| Elev(ft) | Pres.(mb) | SLP(mb) | T(F) | Td(F) | MR(g/kg) | theta(F) | theta-e(K) | |
| Pueblo | 4726 | 856.7 | 1013.6 | 72 | 66 | 16.2 | 96 | 358.2 |
| Victoria | 130 | 1012.1 | 1016.5 | 90 | 74 | 18.1 | 88.1 | 358.6 |
| Dallas | 487 | 1002.9 | 1020.1 | 83 | 71 | 16.5 | 82.6 | 350.0 |
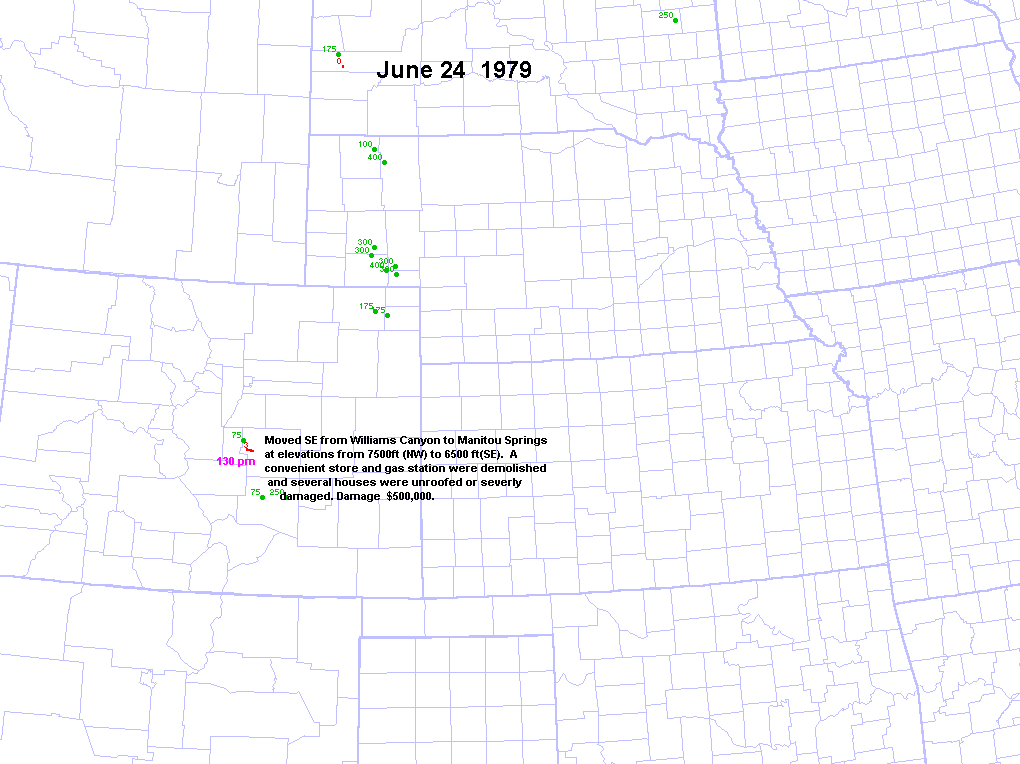
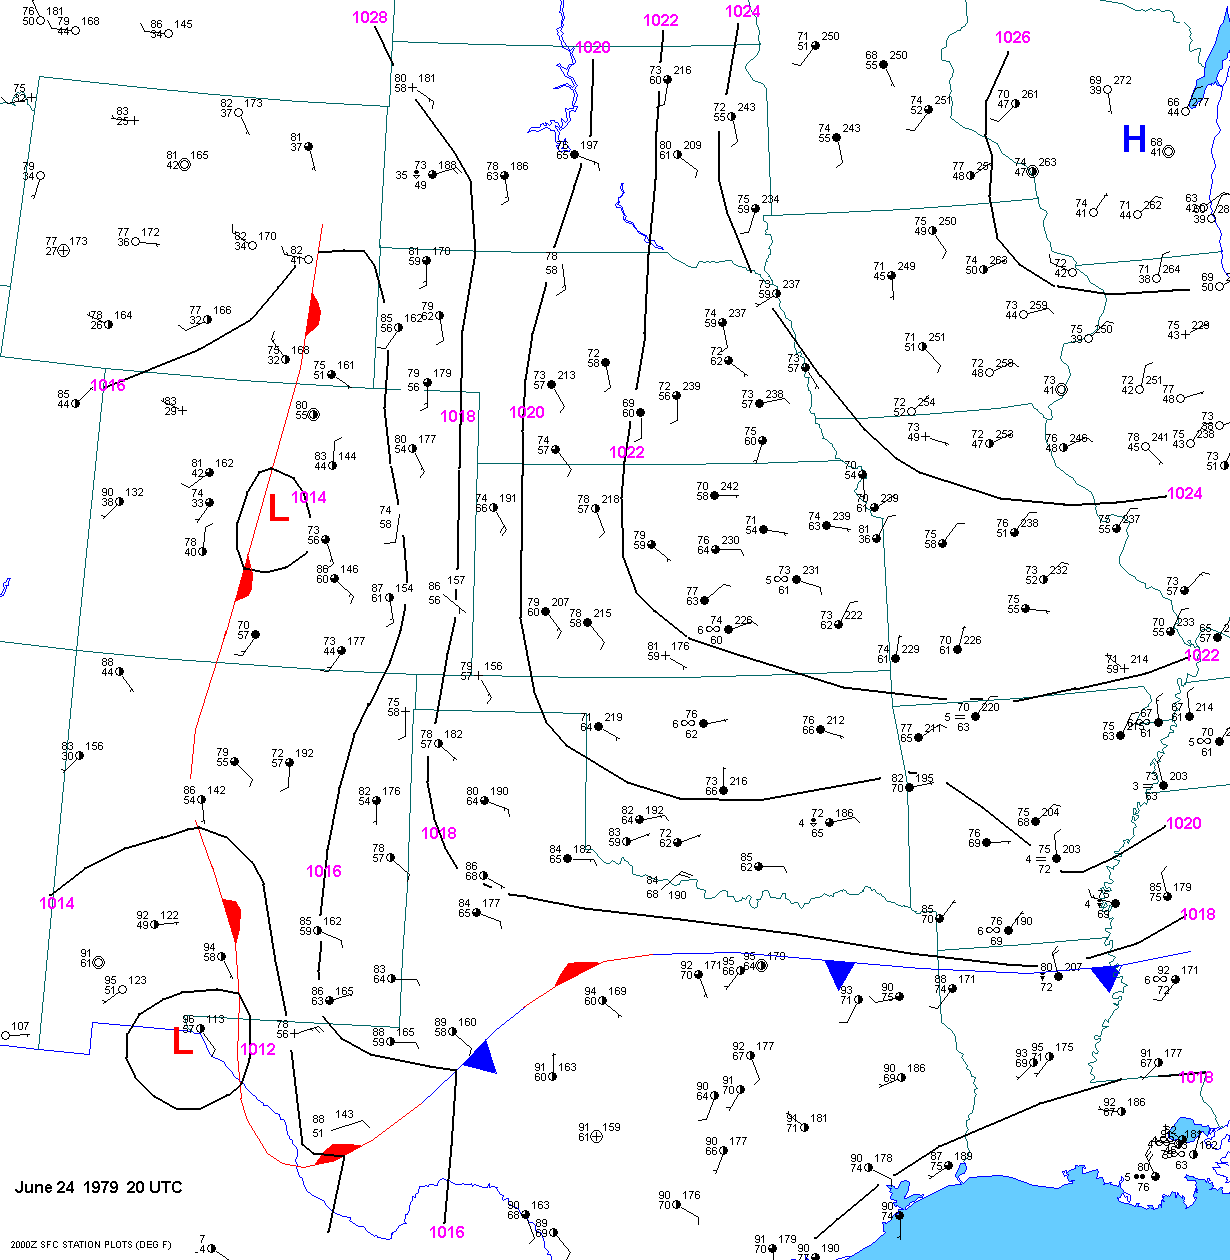
On June
24, 1979, a tornado moved SE down Williams Canyon on the east side
of Pikes Peak to Manitou Springs. A convenient
store and gas station were
demolished. At 20
UTC the T/Td were nearly identical at Colorado Springs(COS) and
Omaha. The 500mb
temperature were also similar
at Omaha and Denver(-12C to -13C). But the theta-e was 351K at COS and
only 326.7K at Omaha.
So the lifted index was
-1 at Omaha and -9 at Colorado Springs. Even though the dewpoint was higher
by 1F at Omaha, the
mixing ratio was actually
17% higher at Colorado Springs. Even though the temperature was the same,
the potential temperature
was 30F higher at Colorado
Springs.
| Elev(ft) | Pres.(mb) | SLP(mb) | T(F) | Td(F) | MR(g/kg) | theta(F) | theta-e(K) | |
| Colo. Springs | 6180 | 814 | 1014 | 73 | 56 | 11.9 | 105.2 | 351 |
| Omaha | 984 | 987 | 1023.7 | 73 | 57 | 10.2 | 75 | 326.7 |
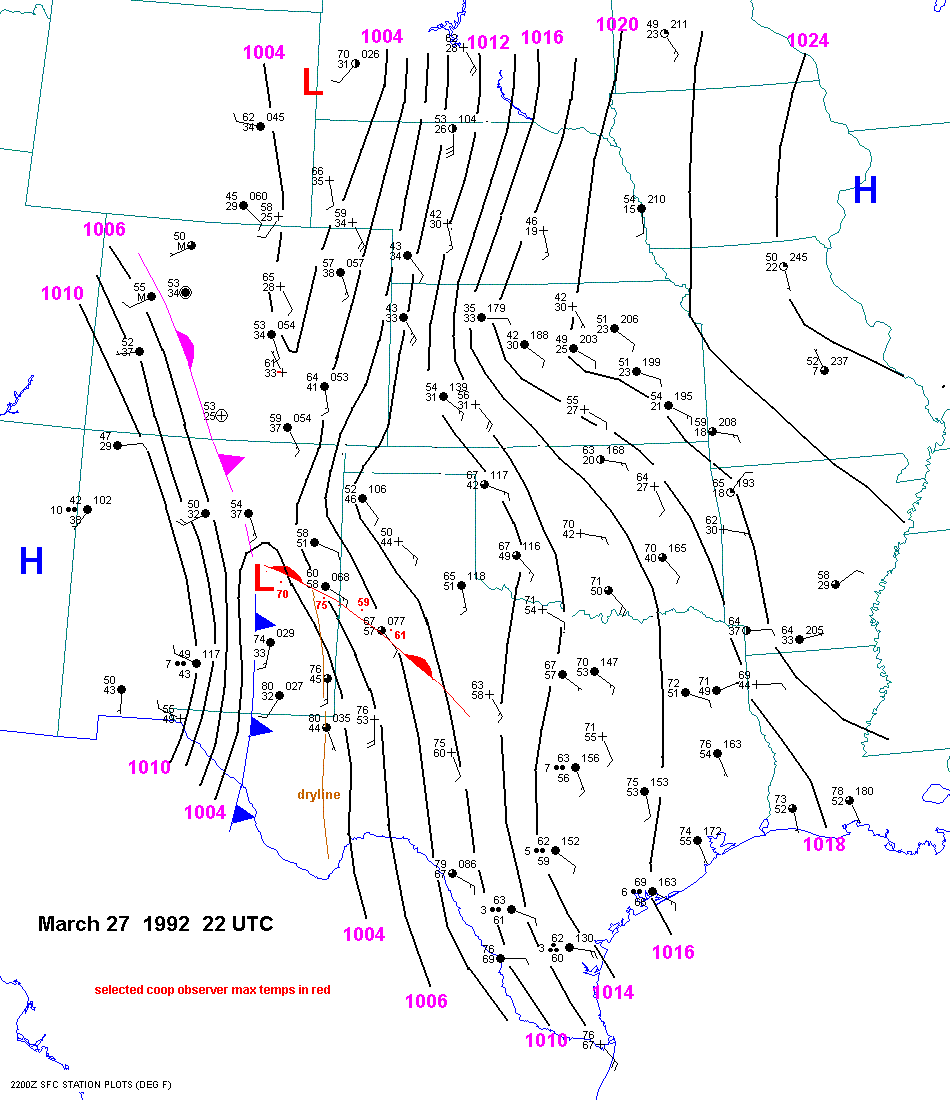
On March
27, 1992, a tornado moved NE from near Farewell, TX to south of
Bovina. At 22
UTC, the T/TD at Clovis were
60F/58F. The T/Td at Brownsville,
TX were 76F/67F. Despite the much higher T/Td values at Brownsville, the
sites had nearly
identical theta-e
values.
| Elev(ft) | Pres.(mb) | SLP(mb) | T(F) | Td(F) | MR(g/kg) | theta(F) | theta-e(K) | |
| Clovis | 4295 | 858 | 1006.8 | 60 | 58 | 12.2 | 83.2 | 337.6 |
| Brownsville | 10 | 1011.7 | 1012.0 | 76 | 67 | 14.2 | 74.2 | 337.7 |
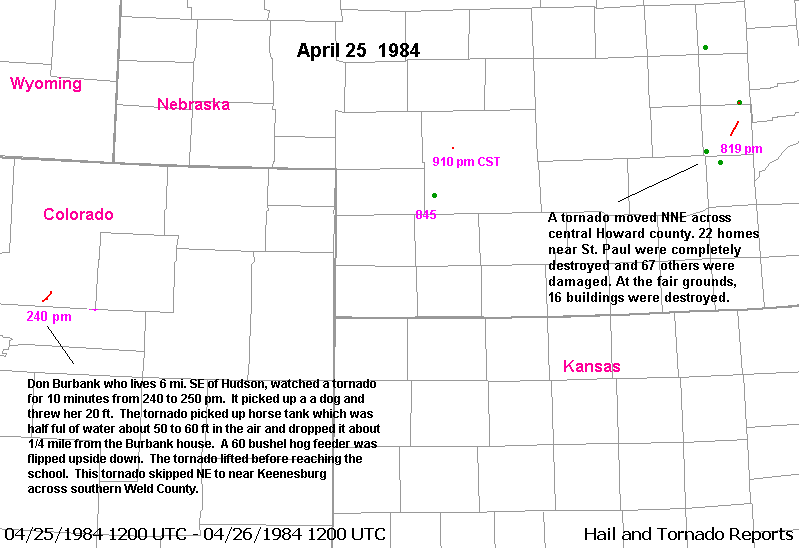
On April
25, 1984, upslope flow developed north of a warm front on the central
high plains. As in most early season severe
weather cases on the front
range, the mid to upper level flow was fairly meridional, with cold mid
level temps(-19C at Denver at
500mb). At 20
UTC the T/Td at Akron, CO(elev. 4700ft) were 64F/46F. The mixing
ratio was 15% higher at Mcalester than
Akron, but the potential
temperature was higher at Akron(91.6F vs 85.9F). So the theta-e was about
the same at the two
locations.
| Elev(ft) | Pres.(mb) | SLP(mb) | T(F) | Td(F) | MR(g/kg) | theta(F) | theta-e(K) | |
| Akron, CO | 4700 | 835 | 986.4 | 64 | 46 | 8 | 91.6 | 330.7 |
| Mcalester, OK | 771 | 975 | 1002.1 | 82 | 54 | 9.2 | 85.9 | 330.8 |
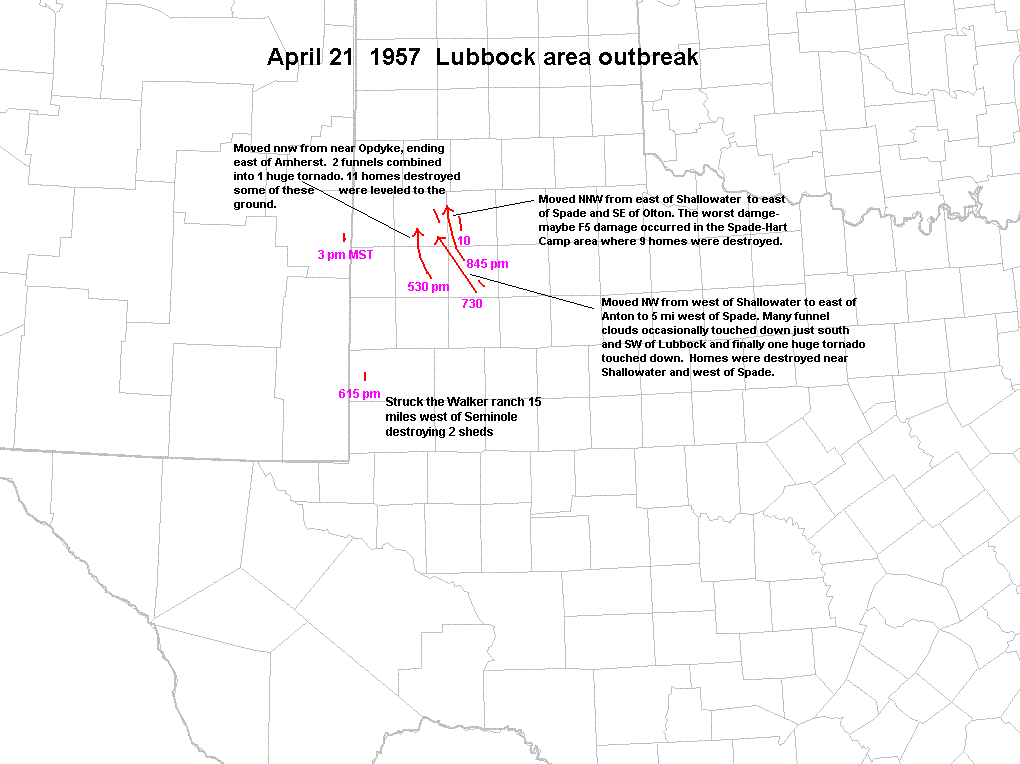
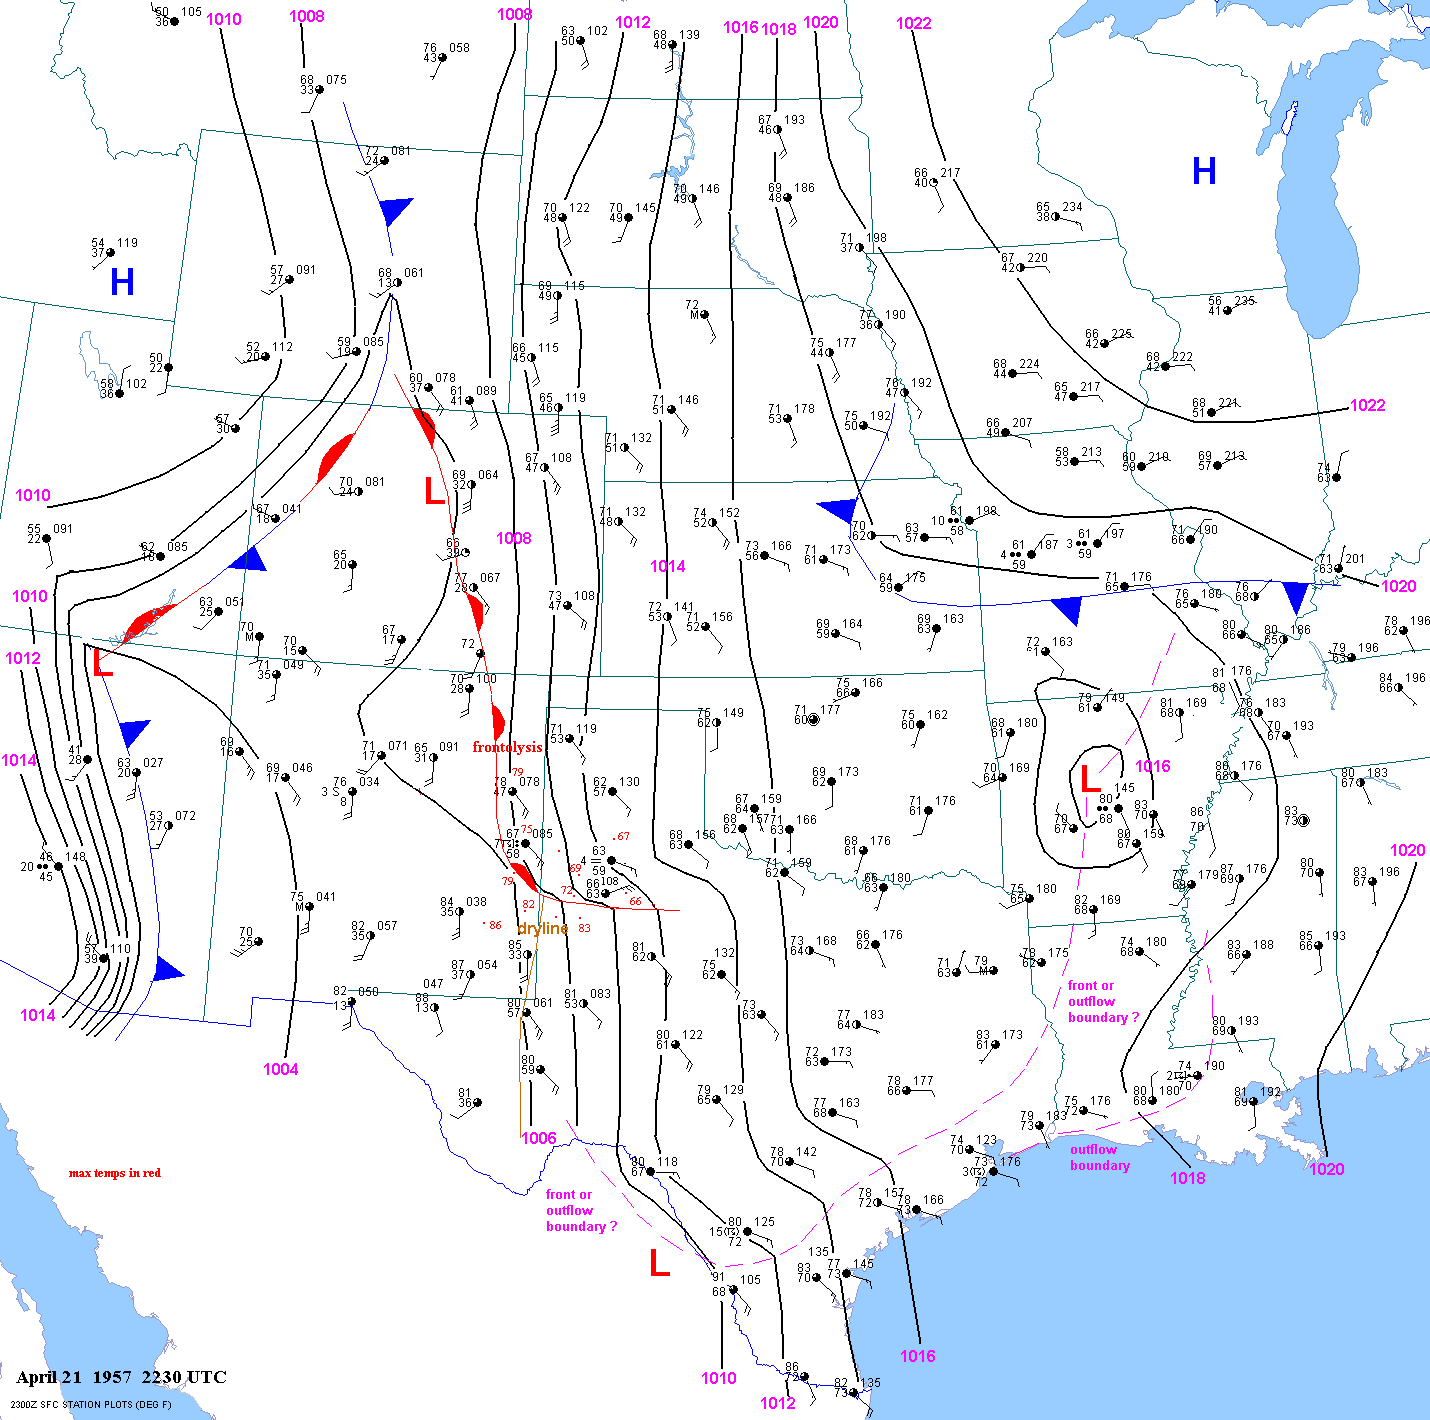
On April
21, 1957, a stationary or warm front was located just south of Lubbock. The T/TD was 67/64 at Lubbock at 0030 UTC.
Meanwhile the T/TD was 74F/72F at Galveston along the gulf coast. The 2230 UTC surface map is similar. Even though the
dewpoint was 8F higher at
Galveston(mixing ratio 17% higher) and despite the temperature
being 7F higher, the theta-e was similar
at the two stations. This is
because the potential temperature was 11.2 F higher at Lubbock.
| Elev(ft) | Pres.(mb) | SLP(mb) | T(F) | Td(F) | MR(g/kg) | theta(F) | theta-e(K) | |
| Lubbock | 3280 | 902 | 1009.5 | 67 | 64 | 14.3 | 82.7 | 343.7 |
| Galveston | 0 | 1017 | 1017.6 | 74 | 72 | 16.8 | 71.5 | 343.5 |