Wyoming, South Dakota and Texas
Severe Weather
June 5 1982
stil under construction!!
Jonathan D.
Finch
Historical Tornado Cases for the Boulder Warning Area
Historical Tornado Cases for the Cheyenne Warning Area
Historical Tornado Cases for the United States
June 03 1958 Wyoming Tornadoes
April 23 1960 Cheyenne Ridge Tornado
April 12 1967 Wyoming Tornado
May 7-8 1965 Front Range Tornado
June 14-17 1965 Front Range Superstorm
The July 16 1979 Cheyenne Tornado
The July 26 1993 Scottsbluff Tornado
Elevated Mixed Layer
Elevated Heating
High plains and front range topo maps
Severe Weather Occurrences
Small areas of high end severe weather occurred on
June 4-5, 1982. Severe weather on June 4, 1982 was confined
to the Nebraska panhandle and western South
Dakota. On June 5, Wyoming, western South Dakota and the Texas
panhandle experienced severe weather. Al Moller decided to storm chase in the Texas panhandle. GOES east satellite
loops for Wyoming and the Texas panhandle as well as the GOES west loop for Wyoming are all very impressive.
The most damaging thunderstorm in the northern high
plains appeared to have developed in northeast Carbon county
in Wyoming (elevation 7500ft). This storm produced
damaging tornadoes in Converse and Niobrara counties in
Wyoming and Fall River county in South Dakota. A
storm that developed around Midwest in Natrona county, WY
resulted in a tremendous hailstorm in Butte county,
SD later in the evening.
Meteorological Discussion
June 4
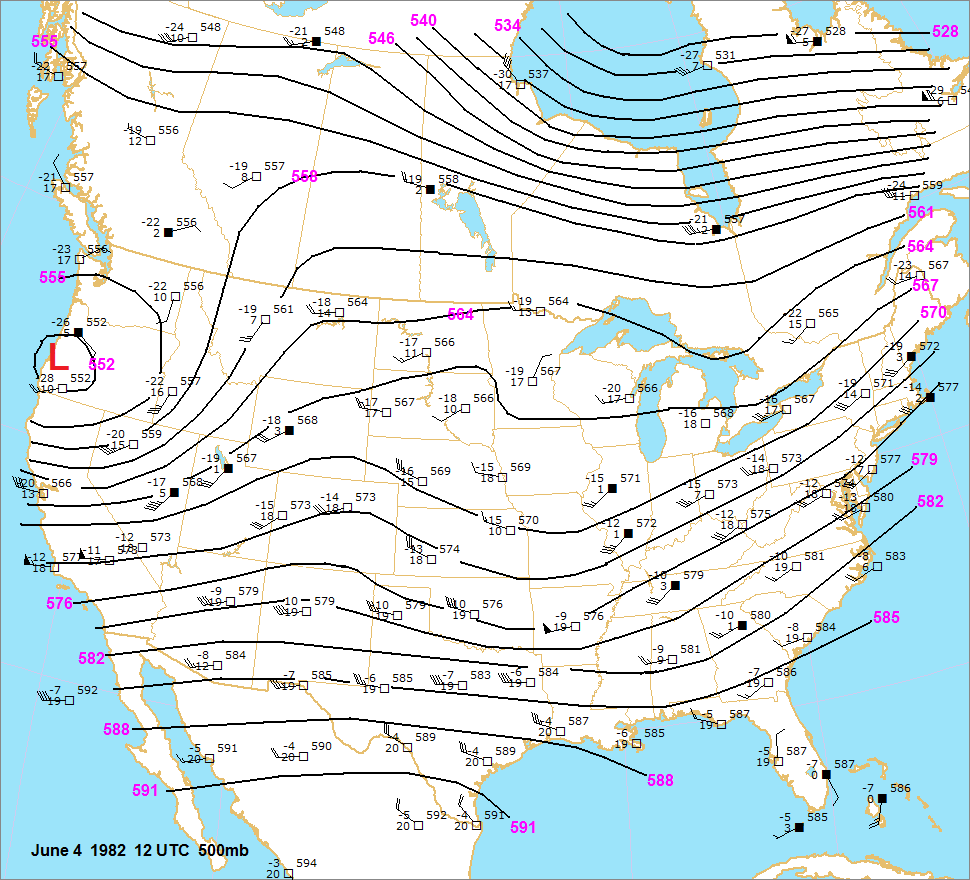
At 12 UTC, a 500mb trough was located over the western United States. A shortwave trough was moving across
Missouri
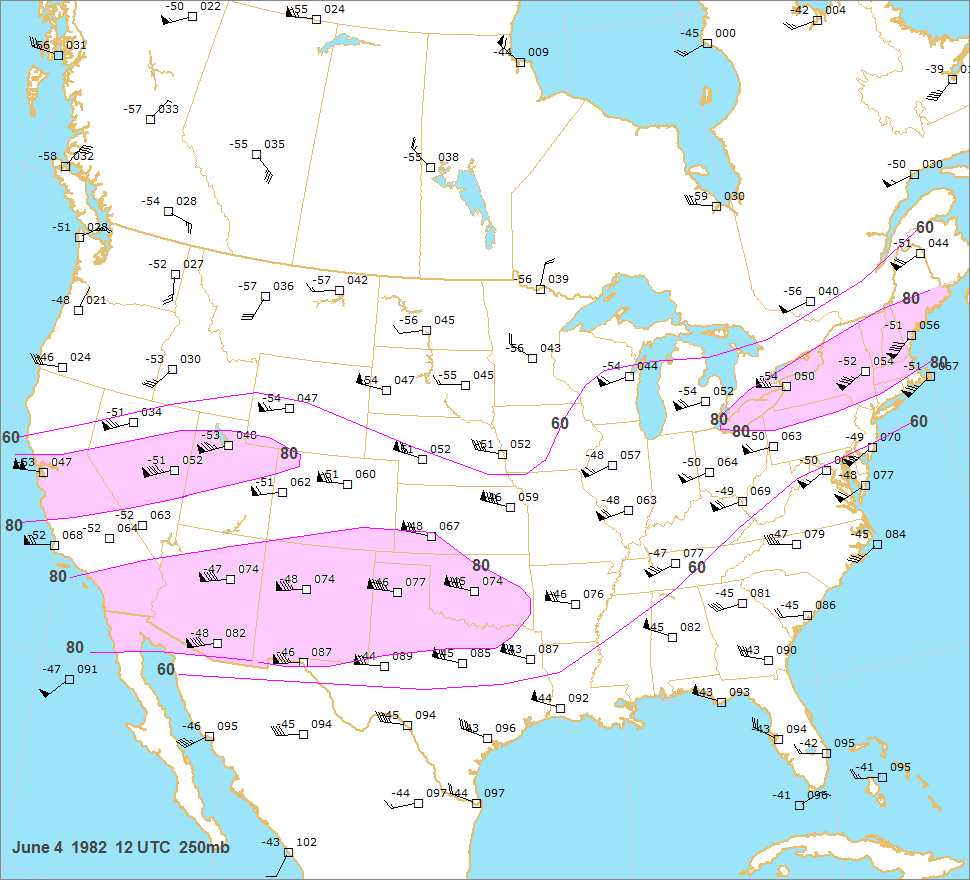
and Arkansas. The 250mb chart showed a jet from the southern plains into the northeast and another
from
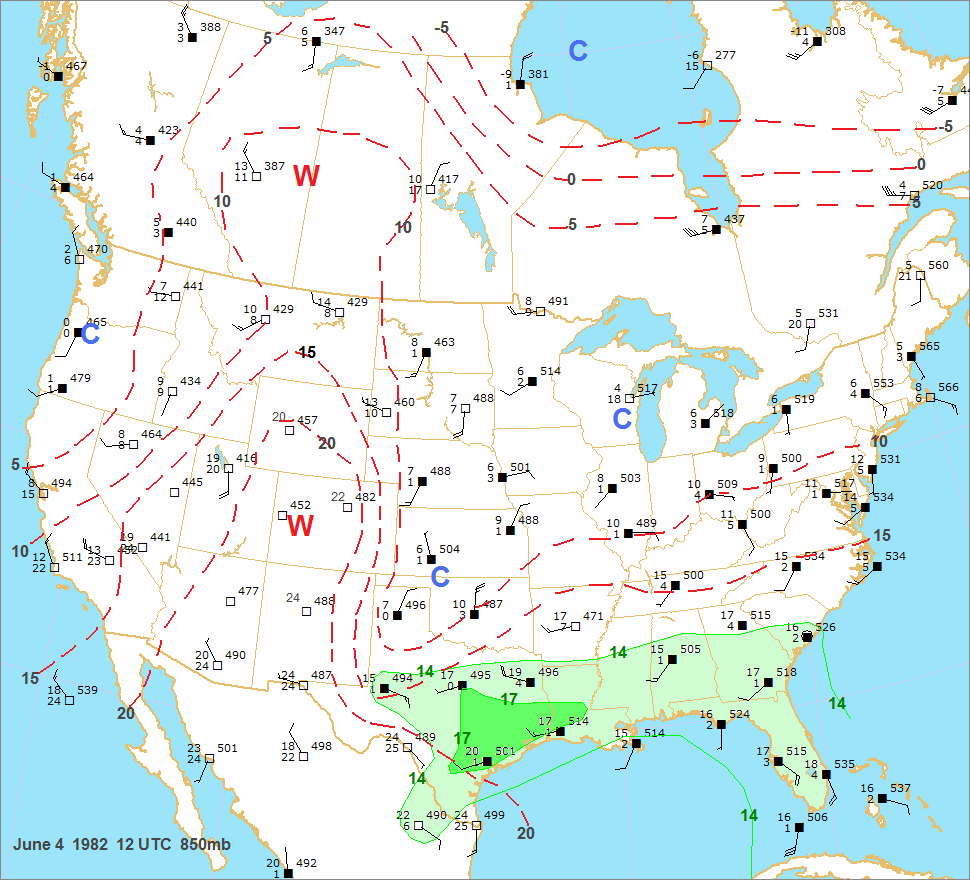
central CA into northern Utah. A warm plume over the Rockies separated
cold air at 850mb along the west
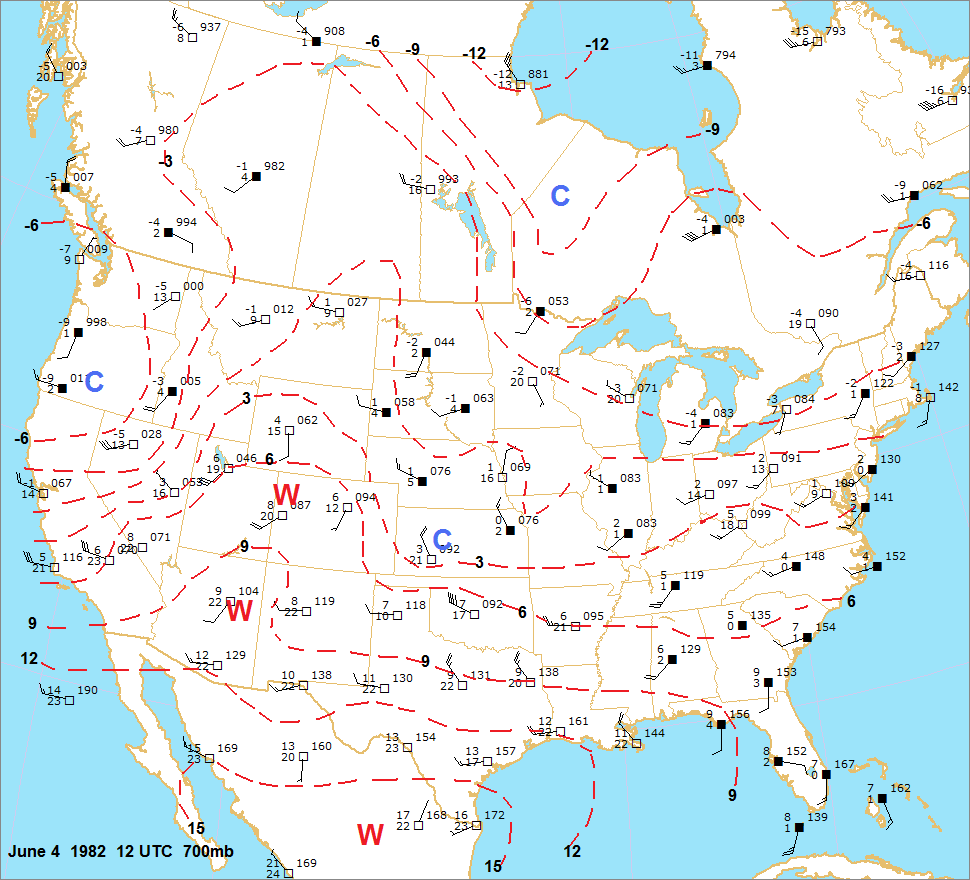
coast from cool air over the plains. 700mb
temperatures were very cold along the west coast.
At 18 UTC on June 4, a cold front was pushing across Wyoming and Utah. A cold front was also pushing through
the southern plains and southeast and extended from
Memphis to Monroe, LA to San Antonio. Cool surface high
pressure extended from Kansas into north
Texas.
By 21 UTC, the Texas cold front was becoming stationary around San Antonio but was still progressing southeast
through east Texas and Louisiana. The weak northern
Rockies cold front was still progressing eastward. By 00 UTC
this front was about to move through Miles City, MT
and was through Douglas, WY.
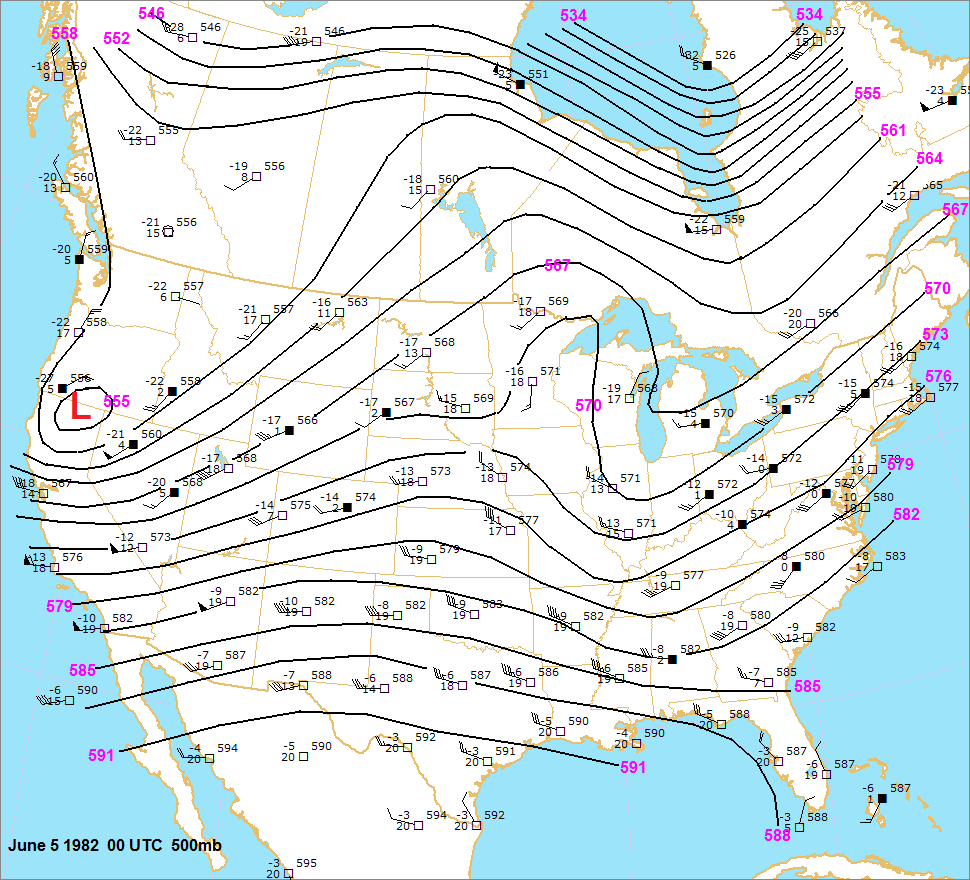
The 00 UTC 500mb chart still showed a deep trough that was centered over northern CA. The shortwave trough
that was centered over Missouri and Arkansas at 12
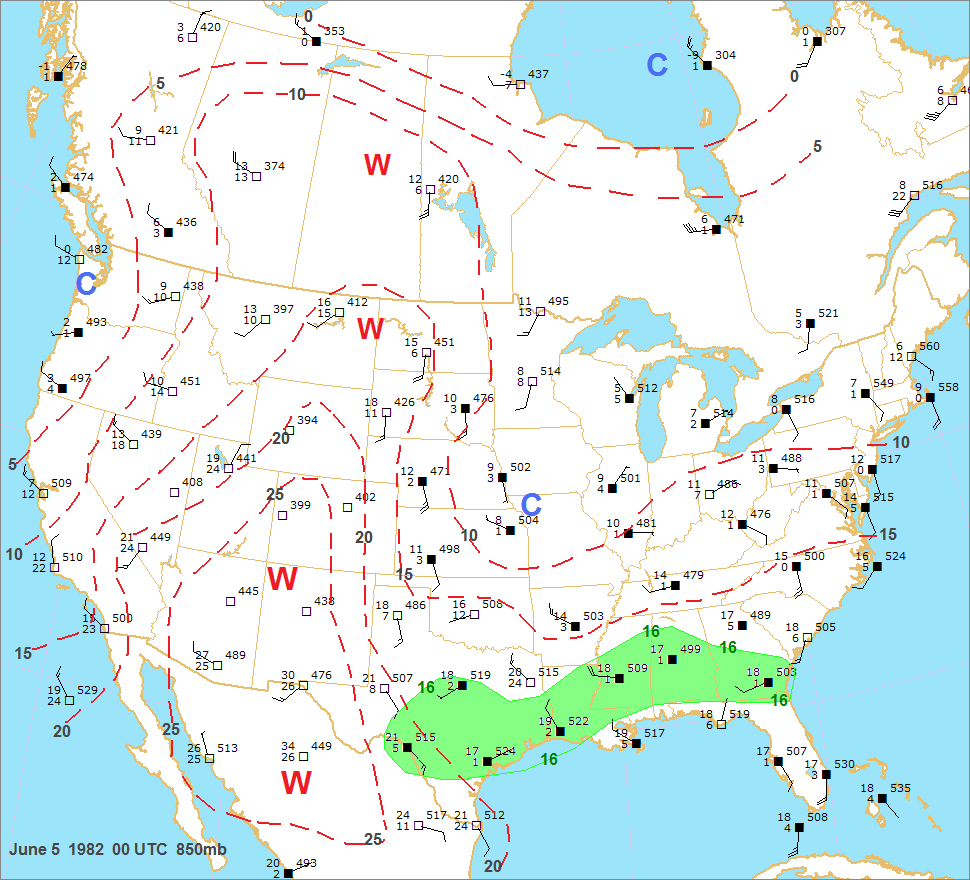
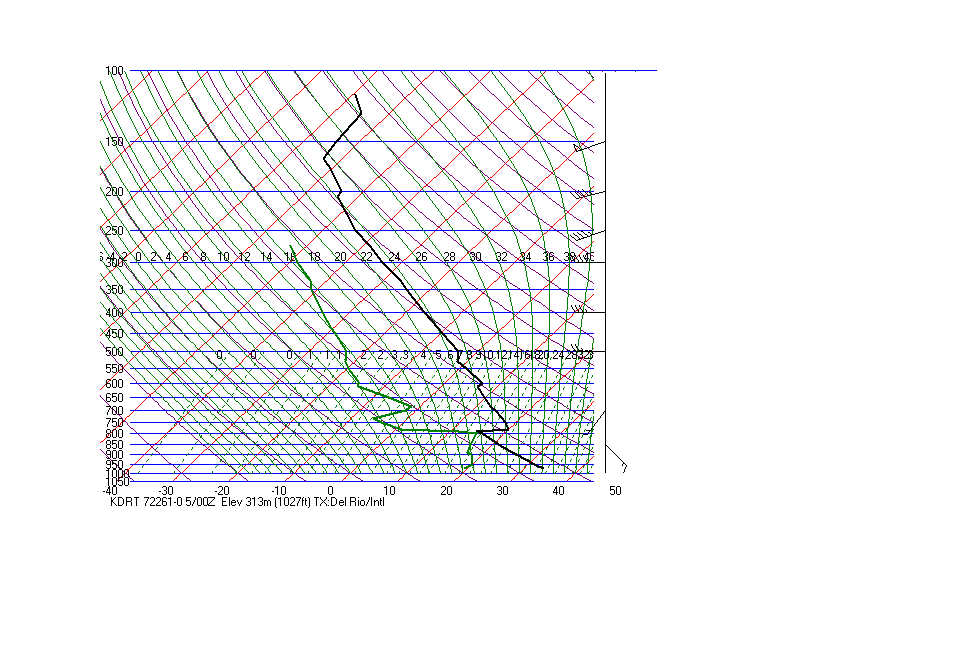
UTC was progressing off to the east. The 850mb chart showed
rich moisture in central and south Texas. With the 500mb ridge
over the central plains and west-southwest flow from
Arizona into west Texas, one would expect lee troughing and
northward moisture transport over west Texas to
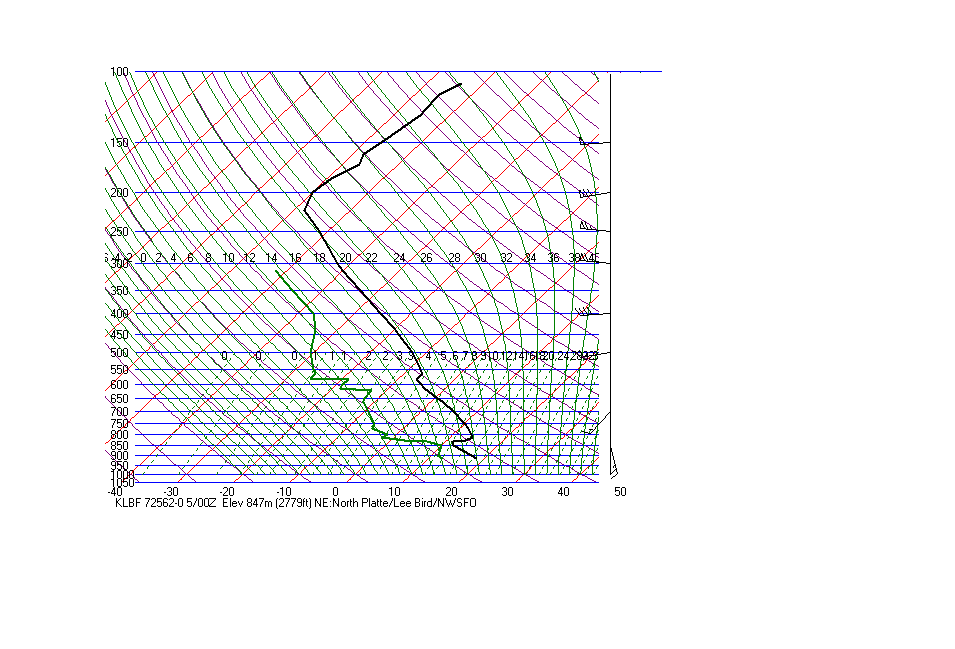
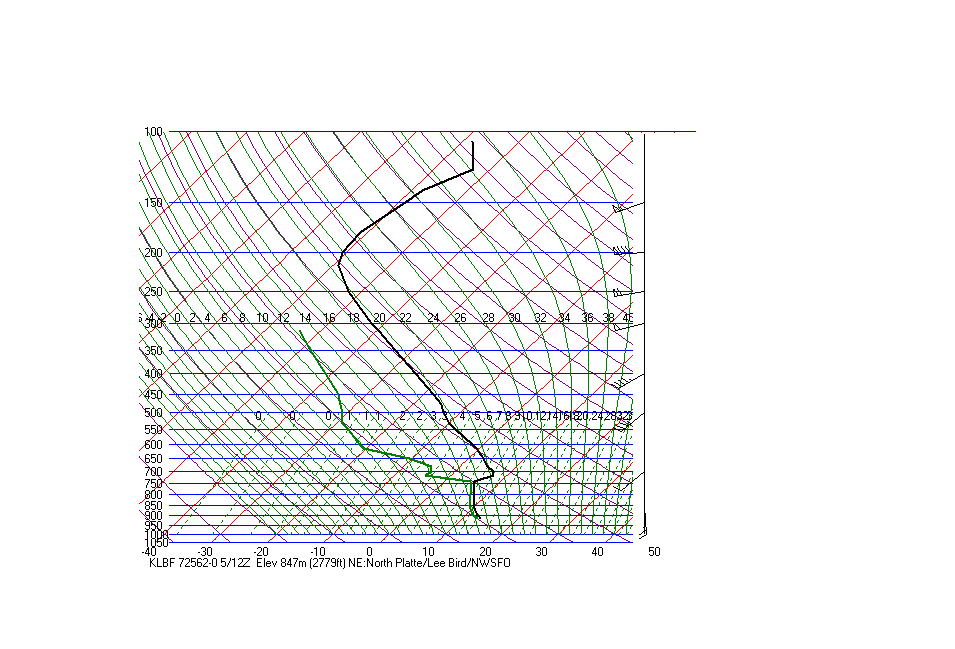
begin. There was also a 10C dewpoint at North Platte at 00 UTC.
This was not due to the incipient southern high
plains moisture surge, but was "residual moisture" from the plain's
cool
and rather moist airmass already in place. This
moist layer at North Platte was only about 60 mb deep though.
Rich, deep moisture was in place at Del Rio.
Strong 700mb warming has occurred during the day over the southern and central Rockies with 11-13C temperatures.
Of course,
part of this warming was diurnal. A warm plume was located over the
Rockies. So why did
I analyze 850mb
temperatures over the Rockies since 850mb is
underground there? Well, I took the temperature at the nose of the
low level
inversion on the
Rockies' soundings down the dry adiabat to 850mb. This actually gives
plain's forecasters an idea of
what 850mb temperatures could
be if strong downslope develops.
By 03 UTC the northern Rockies front was now moving across the northern plains and was approaching Glendive,
MT where a thunderstorm was reported. This front was
not yet through Laramie.
By 06 UTC (11 pm MST June 4) the front was approaching Williston, ND, where a shower was in progress, and was
approaching Cheyenne. As expected from the 00 UTC UA charts,
northward moisture transport was occurring over
west
Texas with a 64F dewpoint at Midland and 60F at Lubbock.
June 5
By 09 UTC June 5, the northern plains front was passing through Brandon, Manitoba and extended to the south-
southwest through Rapid City to near Denver,
CO. The surface dewpoint was up to 61F at Clovis and 62F at
Lubbock.
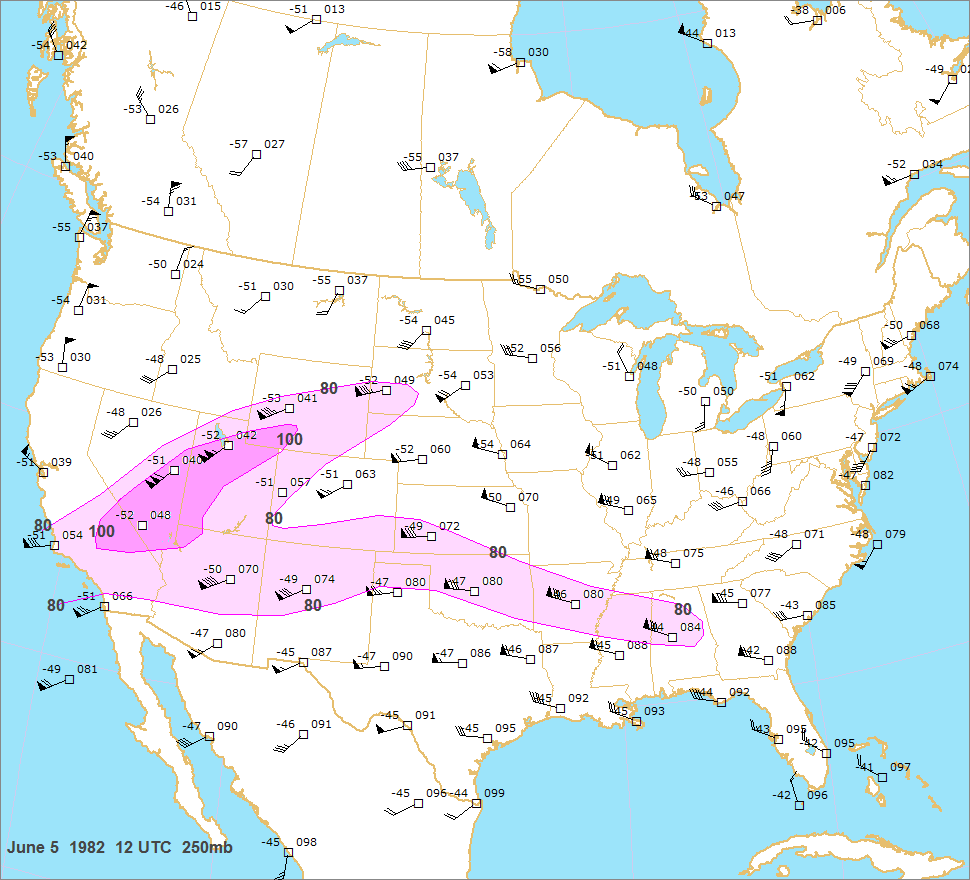
The 12 UTC 250mb chart showed the main jst stream of 110 kts over Salt Lake City and Ely, NV. However, part
of this jet branched off into the southern plains
and deep south. The 500mb chart showed a weak shortwave trough
moving northeast across the northern Rockies and
northern plains. This wave was probably responsible for the weak
cold frontal passage through Cheyenne, Denver and
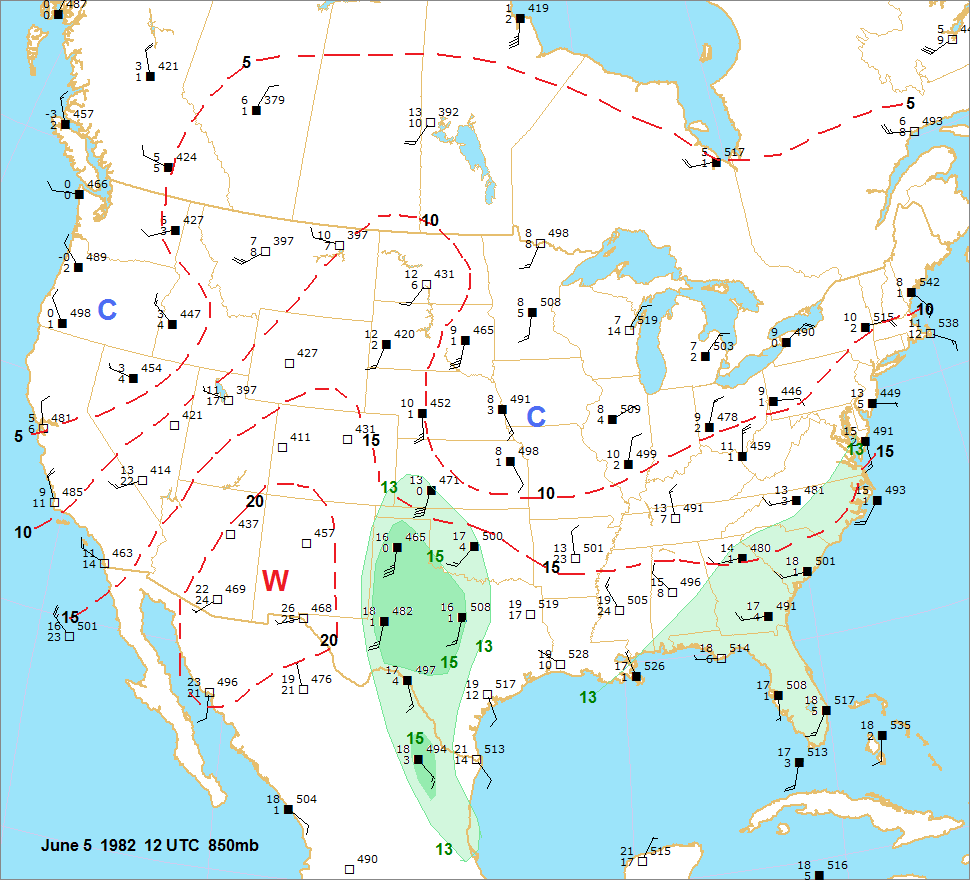
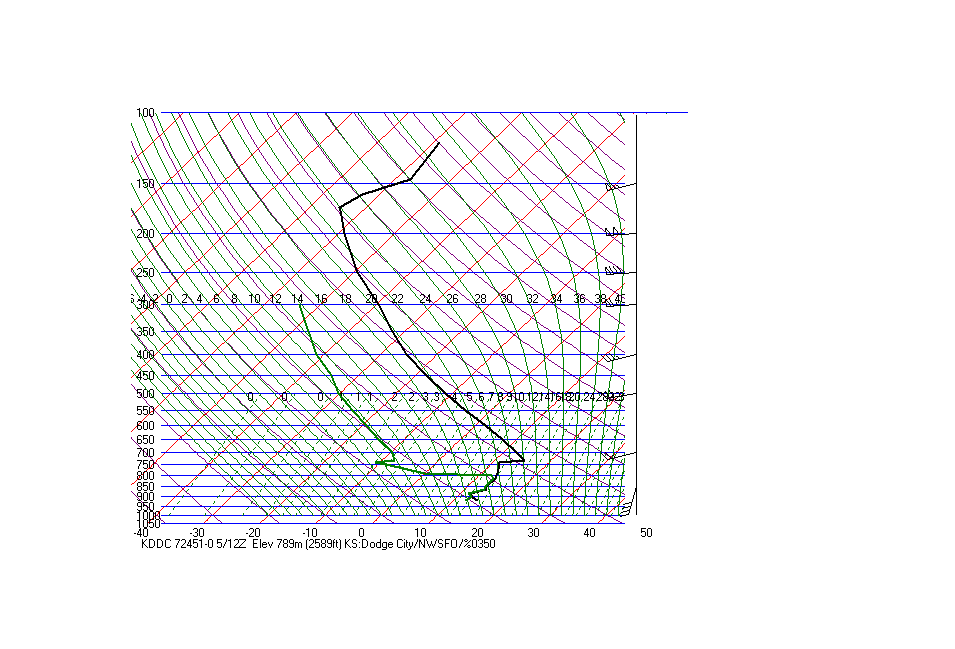
Rapid City. As we suspected, strong moisture advection was
occurring overnight at 850mb. The moisture on the North Platte sounding was not very rich yet, but had deepened
considerably. Much richer moisture was present on
the 12 UTC Dodge City sounding. the 850mb dewpoints at
Amarillo and Midland had increased to 16 and 17C
respectively. Although this moisture was very rich, it was not all
that deep.
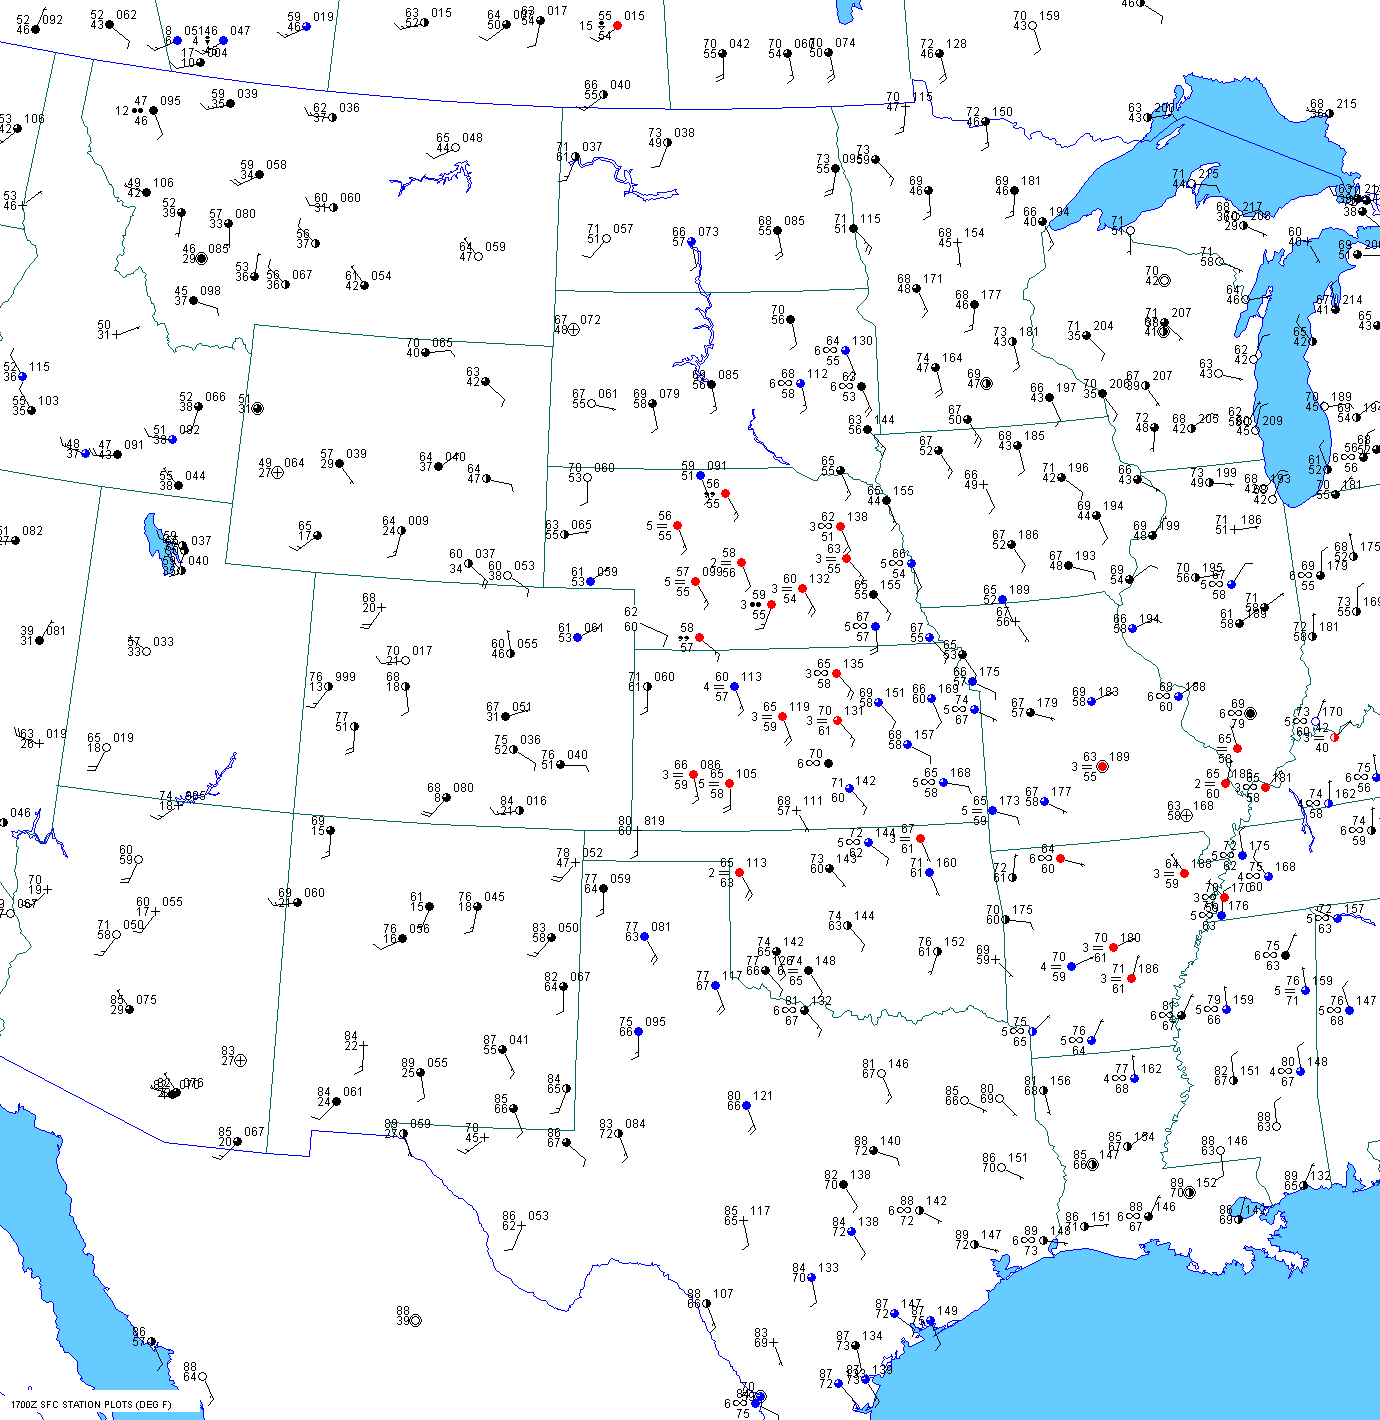
The 12 UTC surface chart showed a 61F dewpoint as far north as Dalhart, TX. The southern surface front was still
stationary near San Antonio. The front that was
sagging south into Colorado overnight was difficult to find since
radiational cooling had occurred ahead of the front.
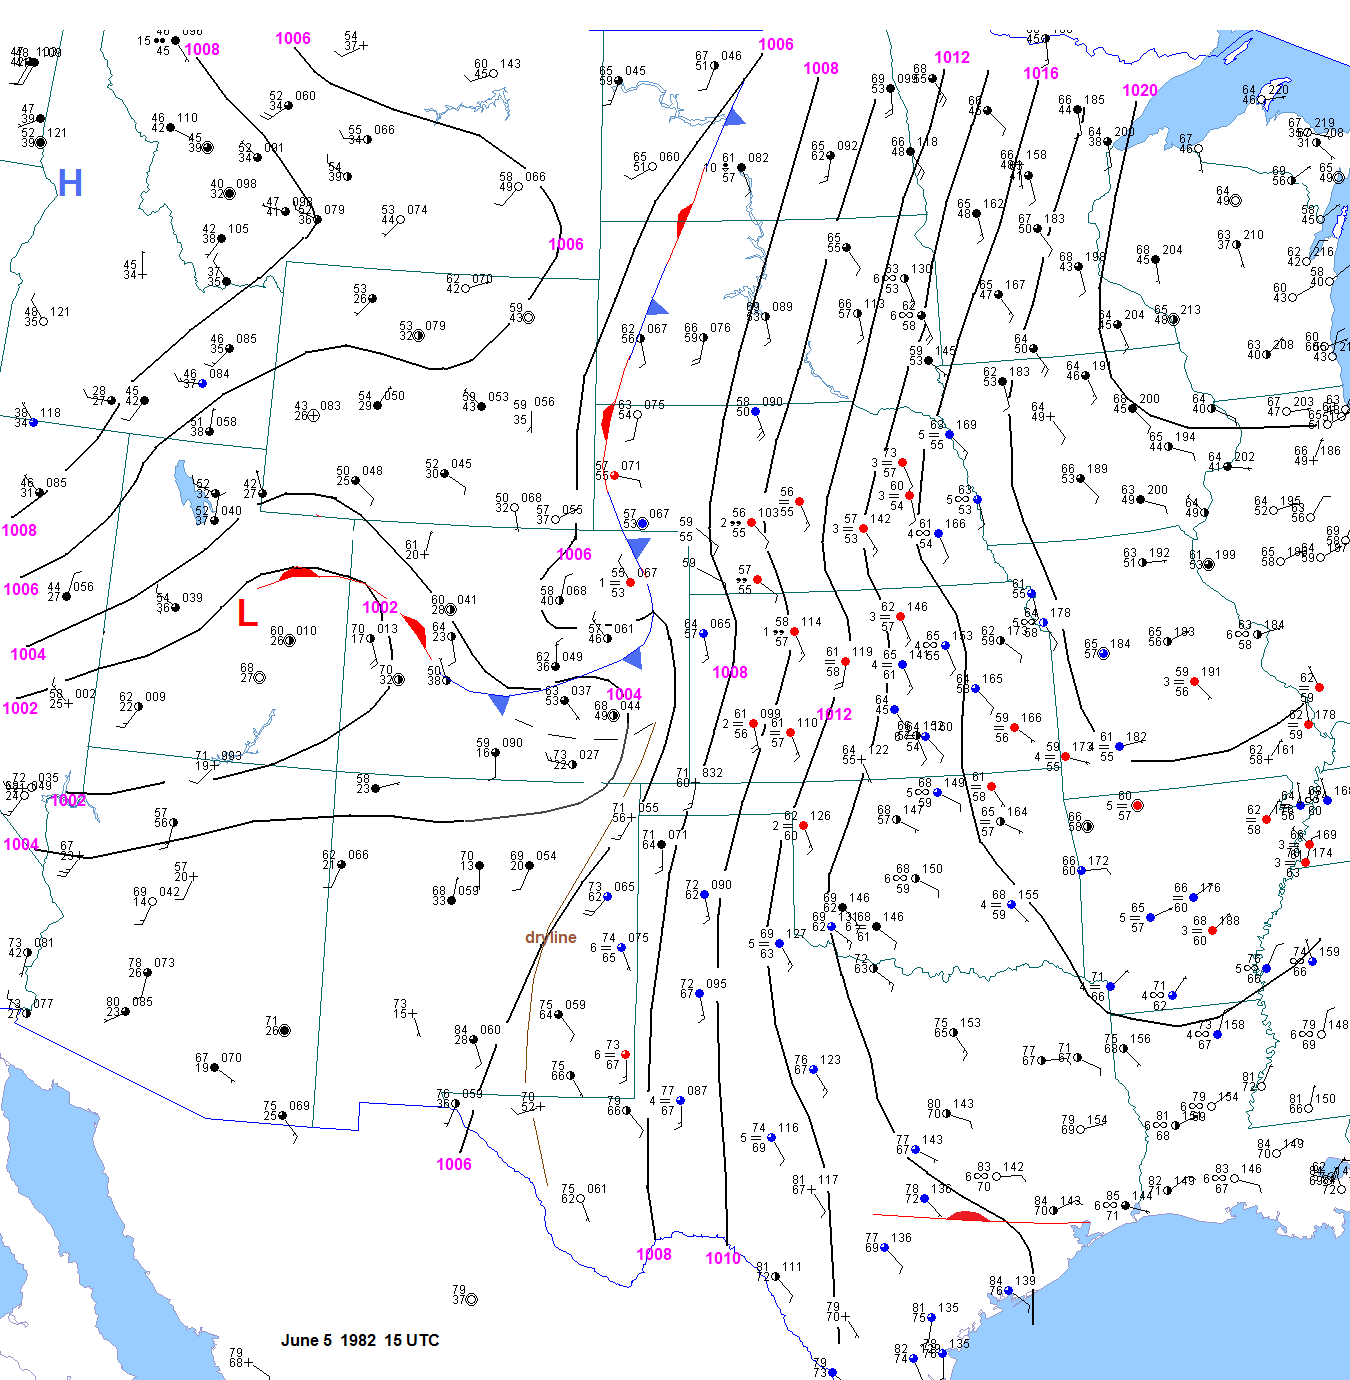
By 15 UTC, the surface moist axis was located from the Texas panhandle into far western Kansas. The cold front
appears
to be still pushing south through Colorado but it was not through
Pueblo and La Junta yet. The northern
part of the front was still located from west of
Bismark to near Rapid City.
By 17 UTC the front that had been moving through Colorado had stalled. the front did not appear to pass through
La Junta and Pueblo despite the east winds at those
locations. I analyzed a trough line south of these stations. It is
very common to get east or southeast winds up the
Arkansas River valley but that doesn't necessarily mean that
a front has passed. The dewpoint at Douglas jumped
from 35 to 47F from 15 to 17 UTC. But was this moisture deep?
60F dewpoints had surged as far north as Goodland,
KS and Champion, NE.
By 18 UTC, the front in Colorado had pulled up stationary. This boundary was actually surging north as a warm front
in Wyoming. I still analyzed a trough line south of
La Junta and Pueblo. The surface dryline was becoming well defined
south of this trough.
The shallow moisture that appeared at Douglas, WY
was already mixing out by 19 UTC. But surface winds in the
Nebraska panhandle were strenghtening from the
east-southeast, advecting moisture into far eastern Wyoming.
Locations such as Rawlins, Rock Springs and Craig
were already mixed out at local noon and this is typical of
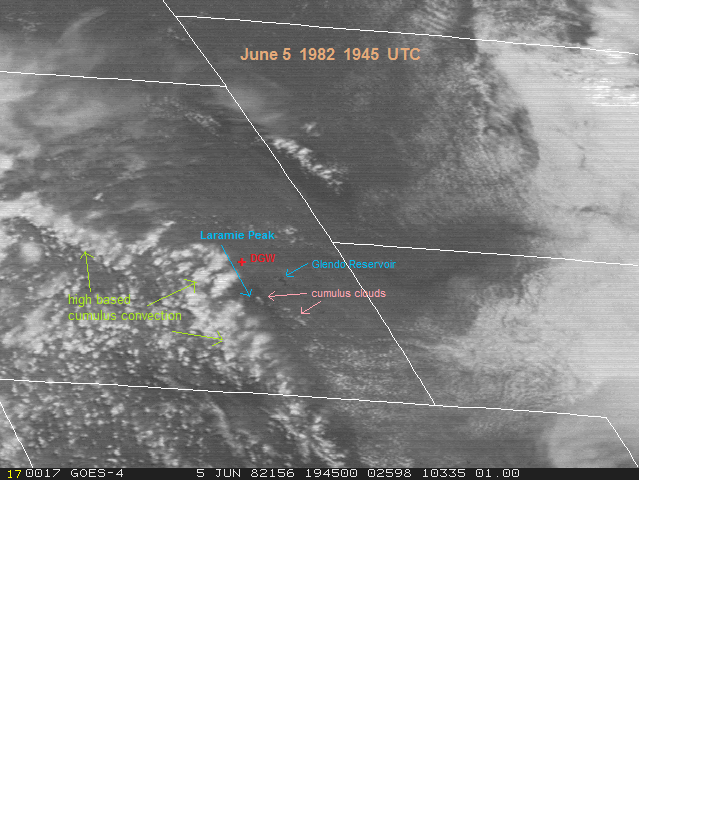
stations above 6000ft. The 1915 UTC visible shot over Wyoming shows some convection developing from west of
Laramie to southwest of Douglas.
By 20 UTC the dewpoints at Rapid City, Chadron and Scottsbluff were up to 56F. But the dewpoint at Douglas, WY
was still 39F. This is surprising given the
southeast winds all morning. It is possible that the dewpoint at
Douglas is
in error. The 1945 UTC visible shot shows surface based cumulus developing south of Glendo Reservoir and near
Laramie Peak.
The 20 UTC satellite picture over the southern high plains showed a few small cumulus in the clear areas to the
east and south of Dalhart. The 2026 UTC southern plains visible picture indicated 2 areas of cumulus. One was south
of Dalhart and the other to the east. At 2041 UTC,
the cumulus to the south of Dalhart in Oldham county seems to
be
bigger. The 2050 UTC visible shot shows this area of cumulus still growing. Also, notice how the clouds change
suddenly from cumulifiorm in southwest Oklahoma
to stable wave
clouds in northwest Oklahoma and southwesrt Kansas.
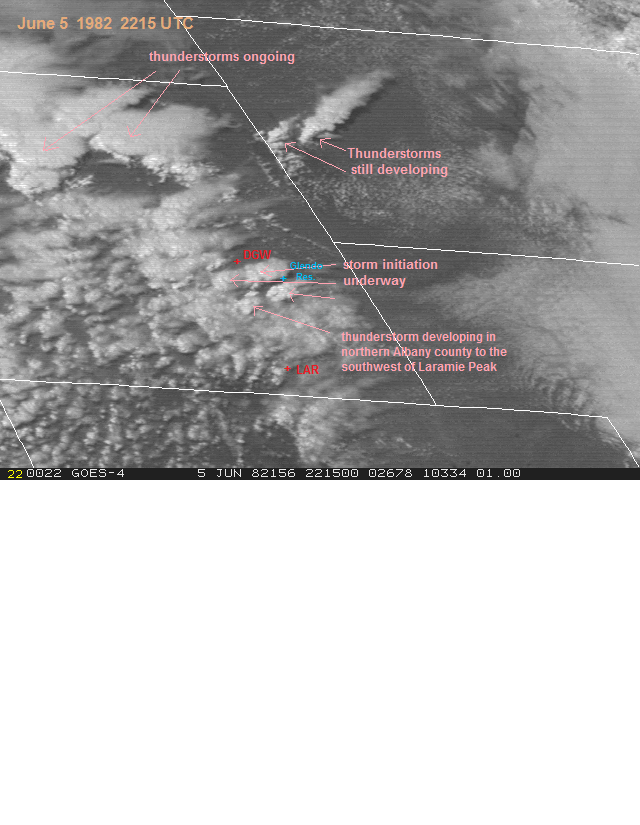
The 21 UTC surface map shows continued moisture return into eastern Wyoming. The 2045 UTC satellite shot still
indicated cumulus development south of the Glendo Reservoir and near Laramie Peak. Thunderstorms had already
developed over the Bighorn mountains northwest of
Casper. Between 2100
and 2130 UTC, a thunderstorm rapidly
developed in the Midwest, Sussex, North Butte area.
A
thunderstorm was also devleoping over the Black Hills.
Thunderstorms started to initiate in southeast
Wyoming around 2145 UTC. The first cells appeared to develop from
south of the Glendo Reservoir and near Laramie Peak.
In the southern plains the surface winds have
backed at Elkhart where the dewpoint jumped from 57 to 64F in 1
hour.
Also the winds were veered at Dalhart and backed at
Amarillo. So the dryline seems to have sharpened in the far
western Texas panhandle. The 2053 UTC satellite shot shows an even larger cumulus south of Dalhart in Oldham
county. There was explosive convective
development between 2100 and 2130 UTC to the east or southeast of
Dalhart. Other convective clouds were rapidly
developing between Amarillo and Clovis. At 2144 UTC, a towering
cumulus can be seen west or southwest of Amarillo
ahead of the surface dryline, or about half way between Amarillo
and Tucumcari.
The 22 UTC surface chart still showed backed winds from the south-southeast at Amarillo with the surface dryline
in the same location. The convective cloud west of
Amarillo was still developing rapidly. The initial thunderstorm that
developed raced off to the northeast.
The dewpoint at Laramie jumped from 39F at 21 UTC to
44F at 22 UTC. The surface dewpoint at Gillette is likely
much too low. Also, it is very uncommon for the
dewpoint at Cheyenne and Laramie to exceed the dewpoint at
Douglas in strong upslope flow cases. At 22 UTC,
several storms were in progress across Johnson, Campbell,
Big Horn and Washakie counties. By 2215 UTC, thunderstorms had developed southwest and west of the Glendo
Reservoir and in northern Albany county to the
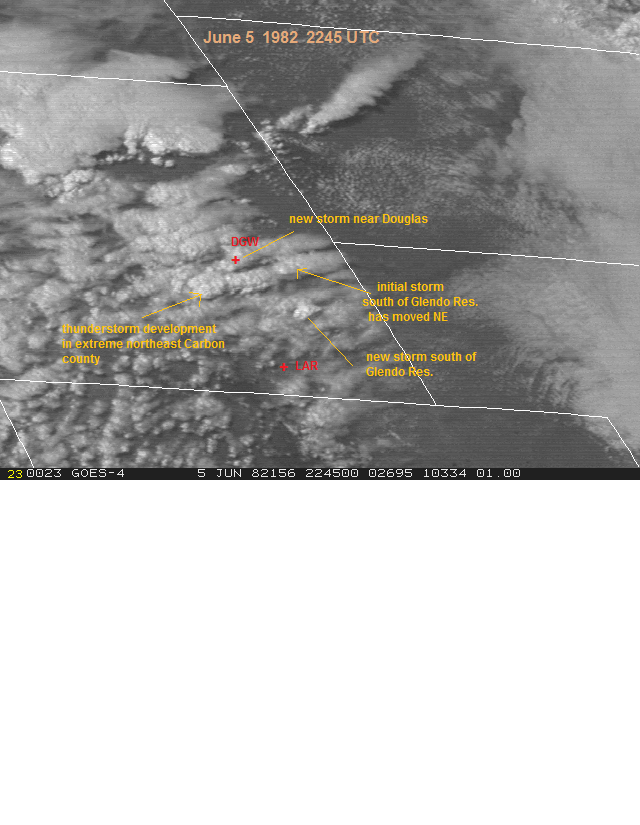
southwest of Laramie Peak. By 2245 UTC, as the initial cells were
moving off to the northeast and about to weaken,
more storms were developing further west due to advection of
higher dewpoints onto the high terrain. One cell in
particular was rapidly developing in far northeast Carbon county.
The following table shows the important contribution
of elevated heating to equivalent potential temperature over the
high terrain. The
temperature/dewpoint at Laramie were only 61F/44F compared to 73F/63F at Emporia, KS. Even
though the T/TD were 12F/19F
higher respectively at Emporia, the theta-e was about the same at the 2
locations. The
44F dewpoint at Laramie has
about the same amount of moisture as a 51F dewpoint at Emporia. So on a
"level playing
field", the dewpoint
was about 12F higher at Emporia. The potential temperature at Laramie
was 101.5F, compared
to 77.8F at Emporia. So
despite the mixing ratio being 61% higher at Emporia, the theta-e was
about the same at
the 2 stations since
Laramie was potentially so much warmer.
| 22 UTC |
Elev(ft) |
Pres.(mb) |
T(F) |
Td(F) |
MR(g/kg) |
theta(F) |
theta-e(K) |
| Laramie |
7270 |
769.3 |
61 |
44 |
8.0 |
101.5 |
336.8 |
| Douglas |
4900 |
839.0 |
69 |
43 |
7.1 |
96.2 |
330.8 |
| Emporia |
1208 |
969.1 |
73 |
63 |
12.9 |
77.8 |
336.3 |
Surface based, deep convection was imminent to the
north-northwest of Laramie a 22 UTC. To get an idea of how
much instability was present in this area, I will
use a method of computing liftex that to my knowledge that has only
been used by myself. Let's take the surface
temperature at several stations in the dry air across southern Wyoming
and western Colorado from 18 to 20 UTC (after
mixout) up the dry adiabat to 700mb and then 500mb and document
the temperature at those levels. This will give us
an idea of the low to mid level thermal profile in the dry air. With
moderate 500mb flow from the southwest, we can
assume that stations to the northeast of these will experience similar
500mb temperatures. Then we will take the surface
temperature and dewpoint at stations in the moist air up to the
lifted condensation level and then up the moist
adiabat to 500mb. Subtracting this temperature from the former
temperature (environmental temperature) will give us
the lifted index in the moist air. Using the above information,
along with the T/Td at
Laramie at 22-23 UTC, yields a surface based lifted index of -7.
| 20 UTC |
Elev(ft) |
Alt |
Pres.(mb) |
SLP(mb) |
T(F) |
Pot. T (F) |
700mb T |
500mb T |
Rawlins
|
6813 |
23.15 |
783.9 |
1000 |
68
|
106 |
10.6 |
-15.3 |
| Rock Springs |
6760 |
23.14 |
783.5 |
|
66.5 |
104.4 |
9.8 |
-16.2 |
| Craig |
6193 |
|
800 |
998.0 |
71 |
105.9 |
10.6 |
-15.3 |
| Eagle |
6540 |
23.38 |
791.6 |
998.0 |
75 |
110.3 |
13 |
-12.9 |
| Grand Junction |
4858 |
24.83 |
840.7 |
998.5 |
80 |
107.4 |
11.3 |
-14.0 |
| Alamosa |
7539 |
22.66 |
767.3 |
|
70-73 |
113.1 |
13.6 |
-12.3 |
| Aspen |
7820 |
|
760 |
|
70 |
112.0 |
14 |
-12.0 |
The 00
UTC upper air charts showed a strong jet streak by early June standards
over Utah, with central and
northeast Wyoming in the left front quadrant. This helps explain
why storms were more widespread in this
region. Above the Rockies boundary layer, the mid to
high level flow was quite strong across central and
northeast Wyoming. The 500mb winds were probably
weaker because of frictional effects of the deep
Rockies boundary layer. This is often the case in
the summer. If course, the 500mb level is really not that
high at places like Rawlins, Laramie, Rock Springs,
Eagle, Leadville and the mountains of central Colorado.
When a strong trough is approaching the Rockies in
summer, the 400mb winds are often quite a bit stronger
than the 500mb winds.
Upper air charts